2. 青岛海洋科学与技术国家实验室 海洋渔业科学与食物产出过程功能实验室 青岛 266071;
3. 中国科学院海洋研究所 青岛 266071
2. Laboratory for Marine Fisheries Science and Food Production Processes, Qingdao National Laboratory for Marine Science and Technology, Qingdao 266071;
3. Institute of Oceanology, Chinese Academy of Sciences, Qingdao 266071
河口作为独特的生态系统,环境复杂多变,基础饵料丰富,是众多渔业生物的产卵场、索饵场和育幼场,对渔业生产发挥了重要作用 (陈渊泉, 1995; 李建生等, 2005; 蒋玫等, 2006)。同时,河口作为海陆交汇的关键区域,也是国内外渔业生态学研究的热点区域 (李建生等, 2004; 钟俊生等, 2005; 单秀娟等, 2011; Jin et al, 2013; Lercari et al, 2015; Selleslagh et al, 2015; Pasquaud et al, 2015; Feyrer et al, 2016),涉及了渔业资源数量变动 (刘勇等, 2004; 林龙山, 2009; Arévalo-Frías et al, 2015; Strydom, 2015)、群落结构 (金显仕等, 2009; Vasconcelos et al, 2015)、优势种及多样性 (李建生等, 2007;李显森等, 2013; Shan et al, 2013; Samedy et al, 2015;孙鹏飞等, 2015) 及其影响因素等 (董方勇, 1997; Obaza et al, 2015)。关于河口生态系统的健康评价也引起了广泛关注 (叶属峰等, 2007; 周晓蔚等, 2011; Sheaves et al, 2012; Dai et al, 2013; Ramos et al, 2012、2015; Whitfield et al, 2015)。这些研究主要基于已有的观测资料,运用相关的统计分析和模型对生态系统健康现状进行分析,但关于不同气候变化情景对河口渔业生态系统健康潜在影响的研究尚未见报道。鱼类群落结构及生物量分布变化被证明是表征河口生态系统健康的重要因子 (Sheaves et al, 2012),因此,本研究运用层次灰色综合评价模型 (Grey Comprehensive Evaluation Model),结合动态生物气候分室模型 (Dynamic Bioclimate Envelope Model) 预估的不同气候变化情景下长江口和黄河口鱼类资源密度增量的分布结果,预估了不同气候变化情景对长江口和黄河口渔业生态系统健康的潜在影响,以期为气候变化背景下近海渔业资源的适应性管理提供科学基础。
1 材料与方法 1.1 数据来源渔业生态系统健康评价中,鱼类资源密度来源于长江口 (单秀娟等, 2016) 和黄河口 (未发表数据) 水域鱼类资源密度增量的预估值,其余变量来源于美国国家海洋大气管理局 (NOAA) 地球物理流体动力学实验室 (Geophysical Fluid Dynamics Laboratory, GFDL) 提供的不同气候变化情景下的预测值 (http://data1.gfdl.noaa.gov/),该预测值是耦合模式比较计划第五阶段 (CMIP5) 的新一代全球气候模式的模拟结果,主要包括pH、溶解氧、无机氮、活性磷酸盐、浮游植物、浮游动物、叶绿素浓度。以2015–2050年36年的数据构建灰色综合评价模型进行分析。
1.2 渔业生态系统健康评价指标体系 1.2.1 评价指标的选择根据层次分析法原理,将渔业生态系统健康作为目标层,将区域的评价因子和评价指标分别作为准则层和指标层,构建了包括渔业生态环境、渔业生物群落结构和渔业生态系统功能在内的3个子系统的递阶层次结构体系来反映渔业生态系统健康。综合考虑资料的科学性和可得性等,并参考相关文献 (杨建强等, 2003; 叶属峰等, 2007; 孙敏, 20121)),共选择8个评价指标 (表 1)。
1) Sun M. Ecosystem health assessment and stress factor analysis on Zhuhai coastal marine areas. Doctoral Dissertation of Ocean University of China, 2012 [孙敏.珠海近岸海域生态系统健康评价及胁迫因子分析.中国海洋大学博士研究生学位论文, 2012]
|
|
表 1 长江口和黄河口渔业生态系统健康评价各指标权重 Table 1 The weight of each index for fishery ecosystem health assessment in the Yangtze River estuary and Yellow River estuary |
选用层次分析法作为确定指标权重的主要方法,层次分析法能够对定性结果进行量化分析,也是应用最广泛的方法之一 (李寇军等, 2007)。层次分析法需要首先建立递阶层级结构,自上而下依次为目标层A、准则层B和指标层C。各层次具体判断矩阵构造方法如下:在渔业生态系统健康的目标层A下,以C为指标层,构造B的判断矩阵;以B为指标层,构造A的判断矩阵。本研究中各矩阵的一致性指标 (CI) 均小于0.1,认为判断矩阵的一致性可以接受。最终,利用层次分析法得到长江口和黄河口渔业生态系统健康评价的准则层和指标层权重值 (表 1)。
1.2.3 综合评价模型采用层次灰色综合评价模型,首先将长江口和黄河口渔业生态系统的n个年份的m个评价指标按照不同指标属性的隶属函数进行数据的初值化处理,建立属性指标值矩阵x。在最优向量G和最劣向量B的基础上计算灰色关联度,然后假设第j个对象向量Xj以uj从属于最优向量G,那么Xj即以 (1-uj) 从属于最劣向量B。为了建立系统的综合评判模型,将经典最小二乘准则进行合理拓展,提出目标函数:
| ${\rm{min}}\left\{ {F\left( u \right) = \mathop {\mathop \sum \limits^n }\limits_{j = 1} {\mkern 1mu} {{\left[ {\left( {1 - {u_j}} \right)\gamma \left( {{X_j},G} \right)} \right]}^2} + {{\left[ {{u_j}\gamma \left( {{X_j},B} \right)} \right]}^2}} \right\}$ |
式中,u为系统的最优解向量:u=(u1, u2, u3, …,
un) 由
| $~{{u}_{j}}=\frac{1}{1+{{\left[ \frac{\gamma \left({{X}_{j}}, B \right)}{\gamma \left({{X}_{j}}, G \right)} \right]}^{2}}}\ \ \ j=1, 2, \cdots, n$ |
利用层次灰色综合评价模型得到了第j个评价对象向量Xj从属于最优向量的程度,即反映该评价对象的优劣程度,从而根据uj的大小对各个评价对象进行优次排序,达到评判目的。
在渔业生态系统,各指标具有不同的属性类型,为了消除不同量纲的影响,需要对灰关联属性指标值矩阵进行规格化处理,即指标初值化。指标初始规格化处理之前,需要对评价指标类型进行区分,指标类型不同,初值化处理方法也不同,具体参考罗小明等 (1994)。根据模式评价指标对渔业生态系统健康评价的影响,本研究选取的指标可分为三类:
第一类为“效益型指标”,该指标取值越大,对渔业生态系统健康越好,如浮游植物丰度、浮游动物丰度、鱼类资源丰度、叶绿素浓度。
效益型指标权重的确定:
| $ ~{{x}_{ij}}=\frac{{{{{x}'}}_{ij}}-\min {{{{x}'}}_{ij}}}{\max {{{{x}'}}_{ij}}-\min {{{{x}'}}_{ij}}} $ |
式中,
第二类为“成本型指标”,该指标的取值越小,对渔业生态系统健康越有利,如无机氮和活性磷酸盐。
成本型指标权重的确定:
| $ {x_{ij}} = {{{\rm{max}}\;{{x'}_{ij}} - {{x'}_{ij}}} \over {\max {{x'}_{ij}} - \min {{x'}_{ij}}}} $ |
第三类为“适当型指标”,该类型指标有一定的最适范围,其取值过低或过高,均会对渔业生态系统产生不利影响,如溶解氧和pH。
适当型指标权重的确定:
| ${x_{ij}} = 1 - {{\left| {{{x'}_{ij}} - {y_i}} \right|} \over {{\rm{max}}\left| {{{x'}_{ij}} - {y_i}} \right|}}$ |
式中,
pH最适值采用《近岸海洋生态健康评价指南》(国家海洋局, 2005) 河口及海湾生态系统水环境评价指标中的Ⅰ类标准。
溶解氧计算公式参考杨建强等 (2003)。
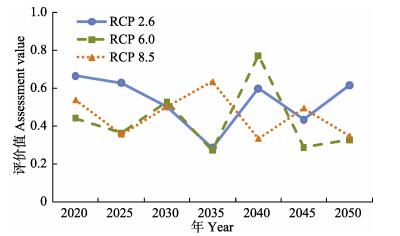
2 结果 2.1 长江口渔业生态系统2015–2050年,长江口渔业生态系统健康水平均值以RCP2.6情景最高,为0.54,RCP6.0和RCP8.5情景较为接近,分别为0.45和0.44(表 2),这与3种情景的温室气体排放程度刚好相反 (RCP2.6、RCP6.0和RCP8.5,分别代表低、中和最高程度的温室气体排放情景)。在生态系统健康水平的离散程度方面,RCP2.6和RCP6.0情景较高,分别为0.30和0.29,RCP8.5情景最低,为0.24。
|
|
表 2 长江口和黄河口渔业生态系统健康评价值 Table 2 The statistic description of fishery ecosystem health assessment in Yangtze River estuary and Yellow River estuary |
单因素方差分析 (One-way ANOVA) 发现,RCP2.6、RCP6.0和RCP8.5情景下长江口渔业生态系统健康水平存在显著差异 (F=6.449, P=0.002)。每5年作为1个时间单位,RCP2.6情景下,渔业生态系统健康水平呈现“高–低–高”的变化趋势,评价值在2020年为0.66,之后呈下降趋势,2035年达到最低值,仅为2020年的42.4%,之后有所回升,2050年基本恢复到2020年时的健康水平;RCP6.0情景下,呈现出“低–高–低”的变化趋势,以2040年健康水平最高,为0.77,其余年份多在0.3–0.5之间波动;RCP8.5情景下,健康水平波动性较RCP2.6和RCP6.0情景低,2035年取得最大值,为0.63,其余年份的健康水平低于其他2个情景或者持平 (图 1)。

|
图 1 不同气候变化情景下长江口渔业生态系统健康水平 Figure 1 Projections of fishery ecosystem health assessment in Yangtze River estuary under climate change scenarios |
若以2050年长江口渔业生态系统健康水平作为“最终状态”,RCP2.6情景下的健康水平明显高于其他2个情景,2050年RCP2.6情景下渔业生态系统的健康评价值为0.61,分别是RCP6.0和RCP8.5情景下健康评价值的1.9倍和1.8倍。
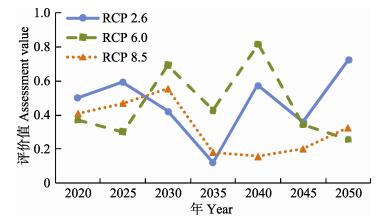
2.2 黄河口渔业生态系统黄河口渔业生态系统健康水平在2015–2050年的均值以RCP2.6情景最高,为0.49,RCP6.0情景次之,健康评价值为0.48,RCP8.5情景最低,为0.41,这与长江口的变化趋势一致。在健康水平的离散程度方面,RCP8.5情景最高,波动性最大,为0.40,RCP2.6情景次之,为0.38,RCP6.0情景最低。
单因素方差分析显示,RCP2.6、RCP6.0和RCP8.5情景下黄河口渔业生态系统健康水平不存在显著性差异 (F=2.638, P > 0.05)。每5年作为1个时间单位,黄河口渔业生态系统健康水平在RCP2.6情景下呈现出“高–低–高”的变化趋势,评价值在2020年为0.50,随后下降,2035年达到最低值,仅为2020年的1/4左右,之后有所回升,2050年达到最大值;RCP6.0情景下呈现“低–高–低”的变化趋势,2030–2040年健康水平较高,其余年份评价值多在0.4以下;RCP8.5情景下呈先升高后降低而后略有回升的趋势,2020–2030年其健康评价值逐渐升高,2030年达到0.55,2035年和2040年迅速降低,渔业生态系统健康评价值只有2030年的1/3左右,2040–2050年健康水平出现小幅升高 (图 2)。

|
图 2 不同气候变化情景下黄河口渔业生态系统健康水平 Figure 2 Projections of fishery ecosystem health assessment in Yellow River estuary under climate change scenarios |
黄河口水域若以2050年渔业生态系统健康水平作为“最终状态”,RCP2.6情景下的健康水平明显高于其他2个情景,RCP2.6情景下的健康评价值分别是RCP6.0和RCP8.5情景的2.8倍和2.2倍。
3 讨论渔业生态系统健康是维持渔业生物多样性,保证渔业生物生产的关键过程稳定持续的基础。气候变化通过对渔业生物的多样性和分布产生影响,进而影响渔业生态系统的健康水平。不同气候变化情景对渔业生态系统健康的潜在影响有所不同,在不考虑捕捞和污染等外界因素影响情况下,长江口和黄河口渔业生态系统健康水平随着温室气体排放程度的增加而降低,即RCP2.6情景下渔业生态系统的健康水平最高,其次是RCP6.0情景,RCP8.5情景最低。在RCP2.6和RCP8.5情景下,长江口渔业生态系统的健康水平高于黄河口渔业生态系统的健康水平;黄河口渔业生态系统健康评价值的离散程度高于长江口,但黄河口生态系统健康评价值最大值要高于长江口渔业生态系统,并且RCP2.6和RCP8.5的健康评价最小值要低于长江口渔业生态系统。以上变化可能与两个河口的生态环境不同有关。长江口属于开放型河口,生态环境对气候变化的影响缓冲能力相对较高,进而基础生产力和渔业生物的变化较小,生态环境、群落结构及生态系统功能相对稳定,渔业生态系统健康水平较高,长江口渔业生态系统健康水平评价中,渔业生态环境子系统所占比重最高,生态环境权重为0.4905,渔业生物群落结构子系统所占比例次之,这在其他海域的研究中也有类似发现 (杨建强等, 2003; 叶属峰等, 2007);而黄河口处于渤海内部,浮游生物、渔业生物种类和群落可迁移的范围较小,种类组成和群落结构演替迅速,导致生态系统的结构和功能发生变化,黄河口渔业生态系统健康评价指标体系中,渔业生物群落结构子系统占比重最高,渔业生态环境子系统占比重次之,渔业生态系统功能子系统最小。气候变化在河口渔业生态系统健康和功能中发挥了重要作用,近海渔业资源的适应性管理中,气候变化应作为一个重要因子考虑在内。
目前,国内外对于渔业生态系统健康评价多局限于评价指标的定性描述,尚未形成统一的理论体系和评价方法 (杨建强等, 2003; Wazniak et al, 2003; Hershner et al, 2007; Platt et al, 2008; 李纯厚等, 2013)。本研究从环境表征因子、生物群落结构和生物群落功能三个方面出发,选择了8个指标,包含了效益型、成本型和适当型三种指标,从目标层、准则层和指标层基本保证了指标覆盖的全面性,模型的评价结果需要长时间序列实测数据验证。但使用层次分析法进行指标权重确定时,指标个数较少容易导致权重系数偏大,使得权重更加明显地分布在个别指标上。因此,在进行渔业生态系统健康评价时,需要综合考虑评价指标的敏感性和可靠性 (Hilty et al, 2000; Vassallo et al, 2006; Muniz et al, 2011),在指标选择、生态系统功能的完整性和可持续性等方面都需要进一步探讨和完善。
| Arévalo-Frías W, Mendoza-Carranza M. Influence of temporal and spatial factors on abundance and richness of fish early stages in shallow tropical estuaries. Environmental Biology of Fishes, 2015, 98(3): 891-904 DOI:10.1007/s10641-014-0324-x | |
| Chen YQ. Fisheries status in estuarine front zone of Changjiang river and adjacent waters. Journal of Fishery Sciences of China, 1995, 2(1): 91-103 [陈渊泉. 长江口河口锋区及邻近水域渔业. 中国水产科学, 1995, 2(1): 91-103] | |
| Dai X, Ma J, Zhang H, et al. Evaluation of ecosystem health for the coastal wetlands at the Yangtze Estuary, Shanghai. Wetlands Ecology and Management, 2013, 21(6): 433-445 DOI:10.1007/s11273-013-9316-4 | |
| Dong FY. A preliminary prediction on the effects of the eastern route of water transferring project from Yangtze River on fisheries resources in Yangytze River estuary. Resources and Environment in the Yangtze Valley, 1997, 6(2): 168-172 [董方勇. 南水北调东线工程对长江口渔业资源的影响. 长江流域资源与环境, 1997, 6(2): 168-172] | |
| Feyrer F, Newman K, Nobriga M, et al. Delta smelt habitat in the San Francisco Estuary: A reply to Manly, Fullerton, Hendrix, and Burnham's "comments on Feyrer et al. modeling the effects of future outflow on the abiotic habitat of an imperiled estuarine fish". Estuaries and Coasts, 2016, 39(1): 287-289 | |
| Hershner C, Havens K, Bilkovic DM, et al. Assessment of Chesapeake Bay program selection and use of indicators. Ecohealth, 2007, 4(2): 187-193 DOI:10.1007/s10393-007-0109-1 | |
| Hilty J, Merenlender A. Faunal indicator taxa selection for monitoring ecosystem health. Biological Conservation, 2000, 92(2): 185-197 DOI:10.1016/S0006-3207(99)00052-X | |
| Jiang M, Shen XQ, Wang YL, et al. Species of fish eggs and larvae and distribution in Changjiang estuary and vicinity waters. Acta Oceanologica Sinica, 2006, 28(2): 171-174 [蒋玫, 沈新强, 王云龙, 等. 长江口及其邻近水域鱼卵、仔鱼的种类组成与分布特征. 海洋学报, 2006, 28(2): 171-174] | |
| Jin X, Shan X, Li X, et al. Long-term changes in the fishery ecosystem structure of Laizhou Bay, China. Science China Earth Sciences, 2013, 56(3): 366-374 DOI:10.1007/s11430-012-4528-7 | |
| Jin XS, Shan XJ, Guo XW, et al. Community structure of fishery biology in the Yangtze River estuary and its adjacent waters. Acta Ecologica Sinica, 2009, 29(9): 4761-4772 [金显仕, 单秀娟, 郭学武, 等. 长江口及其邻近海域渔业生物的群落结构特征. 生态学报, 2009, 29(9): 4761-4772] | |
| Lercari D, Horta S, Martínez G, et al. A food web analysis of the Río de la Plata estuary and adjacent shelf ecosystem: Trophic structure, biomass flows, and the role of fisheries. Hydrobiologia, 2015, 742(1): 39-58 DOI:10.1007/s10750-014-1964-8 | |
| Li CH, Lin L, Xu SN, et al. Establishment of integrated methodology for bay ecosystem health assessment and its application in Daya Bay. Acta Ecologica Sinica, 2013, 33(6): 1798-1810 [李纯厚, 林琳, 徐姗楠, 等. 海湾生态系统健康评价方法构建及在大亚湾的应用. 生态学报, 2013, 33(6): 1798-1810] | |
| Li JS, Cheng JH. Analysis on the dynamic of of fishery biological resources on the fishing grounds of the Changjiang estuary. Marine Fisheries, 2005, 27(1): 33-37 [李建生, 程家骅. 长江口渔场渔业生物资源动态分析. 海洋渔业, 2005, 27(1): 33-37] | |
| Li JS, Li SF, Ding FY, et al. Analysis on annual change of fish diversity in Yangtze estuary offshore water area. Journal of Fishery Sciences of China, 2007, 14(4): 637-643 [李建生, 李圣法, 丁峰元, 等. 长江口近海鱼类多样性的年际变化. 中国水产科学, 2007, 14(4): 637-643] | |
| Li JS, Li SF, Ren YP, et al. Seasonal variety of fishery biology community structure in fishing ground of the Yangtze estuary. Journal of Fishery Sciences of China, 2004, 11(5): 432-439 [李建生, 李圣法, 任一平, 等. 长江口渔场渔业生物群落结构的季节变化. 中国水产科学, 2004, 11(5): 432-439] | |
| Li KJ, Qiu YS, Wang YZ. Influence of natural environment variation on fishery resources in Beibu Gulf. South China Fisheries Science, 2007, 3(1): 7-13 [李寇军, 邱永松, 王跃中. 自然环境变动对北部湾渔业资源的影响. 南方水产科学, 2007, 3(1): 7-13] | |
| Li XS, Yu ZH, Sun S, et al. Ecological niche breadth and niche overlap of dominant species of fish assemblage in Yangtze River estuary and its adjacent waters. Chinese Journal of Applied Ecology, 2013, 24(8): 2353-2359 [李显森, 于振海, 孙珊, 等. 长江口及其毗邻海域鱼类群落优势种的生态位宽度与重叠. 应用生态学报, 2013, 24(8): 2353-2359] | |
| Lin LS. Spatial distribution and environmental characteristics of Harpodon nehereus in the East China Sea region. Journal of Shanghai Ocean University, 2009, 18(1): 66-71 [林龙山. 东海区龙头鱼数量分布及其环境特征. 上海海洋大学学报, 2009, 18(1): 66-71] | |
| Liu Y, Cheng JH, Li SF. A study on the distribution of Setipinna taty in the East China Sea. Marine Fisheries, 2004, 26(4): 255-260 [刘勇, 程家骅, 李圣法. 东海区黄鲫数量分布特征的分析研究. 海洋渔业, 2004, 26(4): 255-260] | |
| Luo XM, Yang HG. A model for grey comprehensive evaluation. Journal of System Engineering and Electronics, 1994, 16(9): 18-25 [罗小明, 杨惠鹄. 灰色综合评判模型. 系统工程与电子技术, 1994, 16(9): 18-25] | |
| Muniz P, Venturini N, Hutton M, et al. Ecosystem health of Montevideo coastal zone: A multi approach using some different benthic indicators to improve a ten-year-ago assessment. Journal of Sea Research, 2011, 65(1): 38-50 DOI:10.1016/j.seares.2010.07.001 | |
| Obaza A, Hoffman R, Clausing R. Long-term stability of eelgrass fish assemblages in two highly developed coastal estuaries. Fisheries Management and Ecology, 2015, 22(3): 224-238 DOI:10.1111/fme.2015.22.issue-3 | |
| Pasquaud S, Vasconcelos RP, Fran a S, et al. Worldwide patterns of fish biodiversity in estuaries: Effect of global vs. local factors. Estuarine, Coastal and Shelf Science, 2015, 154: 122-128 DOI:10.1016/j.ecss.2014.12.050 | |
| Platt T, Sathyendranath S. Ecological indicators for the pelagic zone of the ocean from remote sensing. Remote Sensing of Environment, 2008, 112(8): 3426-3436 DOI:10.1016/j.rse.2007.10.016 | |
| Ramos S, Amorim E, Elliott M, et al. Early life stages of fishes as indicators of estuarine ecosystem health. Ecological Indicators, 2012, 19(8): 172-183 | |
| Ramos S, Cabral H, Elliott M. Do fish larvae have advantages over adults and other components for assessing estuarine ecological quality?. Ecological Indicators, 2015, 55: 74-85 DOI:10.1016/j.ecolind.2015.03.005 | |
| Samedy V, Wach M, Lobry J, et al. Hydroacoustics as a relevant tool to monitor fish dynamics in large estuaries. Fisheries Research, 2015, 172: 225-233 DOI:10.1016/j.fishres.2015.07.025 | |
| Selleslagh J, Amara R. Are estuarine fish opportunistic feeders? The case of a low anthropized nursery ground (the Canche Estuary, France). Estuaries and Coasts, 2015, 38(1): 252-267 DOI:10.1007/s12237-014-9787-4 | |
| Shan XJ, Chen YL, Jin XS, et al. Reshaping the distribution of fish abundance by climate change: A case study in the Yangtze River estuary. Progress in Fishery Sciences, 2016, 37(6): 1-15 DOI:10.11758/yykxjz.20160215002 [单秀娟, 陈云龙, 金显仕, 等. 气候变化对长江口鱼类资源密度分布的重塑作用. 渔业科学进展, 2016, 37(6): 1-15] | |
| Shan XJ, Jin XS. Diversity of fish community structure in the spring-time offshore waters at the Yangtze River estuary. Oceanologia et Limnologia Sinica, 2011, 42(1): 32-40 DOI:10.11693/hyhz201101005005 [单秀娟, 金显仕. 长江口近海春季鱼类群落结构的多样性研究. 海洋与湖沼, 2011, 42(1): 32-40] | |
| Shan XJ, Sun PF, Jin XS, et al. Long-term changes of fish assemblage structure in the Yellow River estuary ecosystem, China. Marine and Coastal Fisheries: Dynamics, Management, and Ecosystem Science, 2013, 5(1): 65-78 DOI:10.1080/19425120.2013.768571 | |
| Sheaves M, Johnston R, Connolly RM. Fish assemblages as indicators of estuary ecosystem health. Wetlands Ecol Manage, 2012, 20(6): 477-490 DOI:10.1007/s11273-012-9270-6 | |
| State Oceanic Administration. HY/T 087-2005. Guidelines for coastal marine ecological health assessment. Beijing: China Standards Press, 2005 [国家海洋局. HY/T 087-2005. 近岸海洋生态健康评价指南. 北京: 中国标准出版社, 2005] | |
| Strydom NA. Patterns in larval fish diversity, abundance, and distribution in temperate South African estuaries. Estuaries and Coasts, 2015, 38(1): 268-284 DOI:10.1007/s12237-014-9801-x | |
| Sun PF, Dai FQ, Chen YL, et al. Seasonal variations in structure of fishery resource in the Yangtze River estuary and its adjacent waters. Progress in Fishery Sciences, 2015, 36(6): 8-16 DOI:10.11758/yykxjz.20150602 [孙鹏飞, 戴芳群, 陈云龙, 等. 长江口及其邻近海域渔业资源结构的季节变化. 渔业科学进展, 2015, 36(6): 8-16] | |
| Vasconcelos RP, Henriques S, Franc S, et al. Global patterns and predictors of fish species richness in estuaries. Journal of Animal Ecology, 2015 DOI:10.1111/1365-2656.12372 | |
| Vassallo P, Fabiano M, Vezzulli L, et al. Assessing the health of coastal marine ecosystems: A holistic approach based on sediment micro and meio-benthic measures. Ecological Indicators, 2006, 6(3): 525-542 DOI:10.1016/j.ecolind.2005.07.003 | |
| Wazniak C, Goshorn D, Hall M, et al. Maryland's coastal bays ecosystem health assessment. Annapolis, MD, USA: Maryland Department of Natural Resources, 2004: 1-7 | |
| Whitfield AK. Why are there so few freshwater fish species in most estuaries?. Journal of Fish Biology, 2015 | |
| Yang JQ, Cui WL, Zhang HL, et al. Marine ecosystem health structure and function index assessment in the west of Laizhou Bay. Marine Science Bulletin, 2003, 22(5): 58-63 [杨建强, 崔文林, 张洪亮, 等. 莱州湾西部海域海洋生态系统健康评价的结构功能指标法. 海洋通报, 2003, 22(5): 58-63] | |
| Ye SF, Liu X, Ding DW, et al. Ecosystem health assessment of the Changjiang River estuary: Indicator system and its primarily assessment. Acta Oceanologica Sinica, 2007, 29(4): 128-136 [叶属峰, 刘星, 丁德文, 等. 长江河口海域生态系统健康评价指标体系及其初步评价. 海洋学报, 2007, 29(4): 128-136] | |
| Zhong JS, Yu WW, Liu BL, et al. Seasonal occurrences of fish larvae and juveniles in the surf zone of the Yangtze River estuary. Journal of Shanghai Fisheries Univeristy, 2005, 14(4): 375-382 [钟俊生, 郁蔚文, 刘必林, 等. 长江口沿岸碎波带仔稚鱼种类组成和季节性变化. 上海水产大学学报, 2005, 14(4): 375-382] | |
| Zhou XW, Wang LP, Zheng BH. Studies on ecosystem health evaluation in the Yangtze River estuary and its adjacent waters. Journal of Hydraulic Engineering, 2011, 42(10): 1201-1208 [周晓蔚, 王丽萍, 郑丙辉. 长江口及毗邻海域生态系统健康评价研究. 水利学报, 2011, 42(10): 1201-1208] |


