2. 青岛海洋科学与技术试点国家实验室海洋渔业科学与食物产出过程功能实验室 青岛 266071;
3. 中国海洋大学水产学院 青岛 266003;
4. 上海海洋大学海洋科学学院 上海 201306
2. Laboratory for Marine Fisheries Science and Food Production Processes, Pilot National Laboratory for Marine Science and Technology (Qingdao), Qingdao 266071;
3. College of Fisheries, Ocean University of China, Qingdao 266003;
4. College of Marine Sciences, Shanghai Ocean University, Shanghai 201306
渔业资源调查是实现渔业资源科学管理和养护的数据基础(Keith et al, 2012; Jennings et al, 2001; Blanchard et al, 2008),而商业渔业所提供的有限调查数据不能满足渔业资源科学管理与养护所需的基础信息(Starr et al, 2010),独立于商业渔业的科学调查是渔业资源和生态系统管理不可或缺的,其相对于依靠商业渔业的调查具有易受各种因素制约、成本高、耗时长的特点(Scheirer et al, 2004)。因此,渔业资源科学调查在执行之前需要进行调查站位设计,确保满足研究与管理需求而且节约成本(Simmonds et al, 1996; 赵静等, 2014)。
调查站位优化是有效改善渔业资源评估精度的方法(Liu et al, 2009),相关的研究在国内外也广泛开展。分层随机采样常用来优化渔业资源调查站位(Cochran, 1977),并且在调查站位数量确定的条件下,分层随机采样相比定点采样和简单随机采样分析资源丰度或群落丰富度效果更优(Liu et al, 2009; 赵静等, 2014; Xu et al, 2015)。目前的研究目标单一(侧重资源丰度或群落丰富度),而不同目标的站位优化产生数据精度不同,优化目标能一定程度上提高用于资源量评估的数据质量(Smith et al, 1993)及优化评估鱼类群落结构的数据(Greenstreet et al, 2008)。不同的站位分配方案会对站位设计的精度产生很大的影响(李金昌, 2007),分层站位数分配通常采用每层站位数与每层面积或潜在站位成正比(赵静等, 2014; Xu et al, 2015),内曼分配规则提倡站位数应与采样的方差成正比(Cochran, 1977),抽样费用最优准则则考虑了调查成本与采样精度的平衡。而目前对多目标资源调查站位优化的研究,及多目标资源调查站位优化中渔业生物分布潜在站位预测、站位数固定时每层站位分配方案对调查数据的影响等方面的研究未见报道(Miller et al, 2007),需要在这些方面开展研究以满足合理设计多目标资源调查的需求。
渤海历史上曾是黄渤海渔业的摇篮,也是众多渔业生物的关键栖息地和优良渔场(金显仕等, 2015)。目前,在过度捕捞、环境污染和围填海等多重压力下,渤海渔业资源衰退严重、生物多样性下降、生态服务功能受损(金显仕等, 2015; 李忠义等, 2018; 林群等, 2016; 卞晓东等, 2018)。渤海是蓝色海湾计划的重点区域,渔业资源的养护也是蓝色海湾计划的重点内容之一。因此,建立渤海渔业资源调查的科学调查体系是实现渔业资源科学管理和养护的迫切需求。
本研究以渤海渔业资源拖网调查数据作为广义性模型(Generalized linear model, GLM)和广义可加模型(Generalized additive model, GAM)模型的基础数据,预测渔业生物在渤海的分布,并假设预测的渔业生物分布为其在渤海的“真实”分布,通过数值模拟,分析了种类出现率(基于渤海调查的17个主要种类分为3类:Ⅰ类出现率≥70%,Ⅱ类出现率50%~70%,Ⅲ类出现率 < 50%)和栖息水层对单种类资源量REE的影响,及不同调查站位数量(48和60)对定点采样与分层随机采样分析结果的影响,并优化了渤海多目标种类渔业资源调查的设计方案,以期为渤海渔业资源科学调查体系建立提供技术支撑,为渔业资源的科学管理与养护提供科学基础。
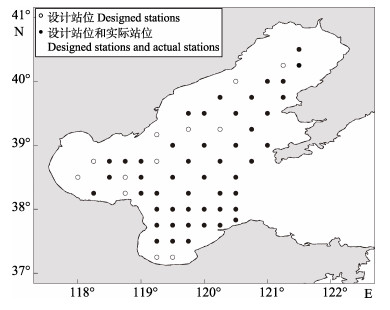
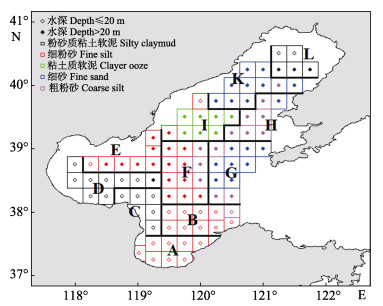
1 材料与方法 1.1 研究区域渤海(117°50'~122°35'E, 37°10'~41°N)包括辽东湾、渤海湾、莱州湾和渤海中部,平均水深为18.7 m,仅在东部通过渤海海峡与黄海相连,水交换能力较差。注入渤海的河流众多,其中,黄河的年径流量几乎占到了1/2(马伟伟等, 2016; 刘效舜等, 1990)。渤海海底沉积主要分为粉砂质粘土软泥、细粉砂、粘土质软泥、细砂和粗粉砂5种类型(刘效舜等, 1990)。渤海是渔业种群的关键栖息地,渔业资源丰富。为实现渔业资源科学管理和养护,有必要对其开展渔业资源调查。以往渤海渔业资源调查站位覆盖渤海大部分海域(图 1),本研究在之前调查的基础上,扩展了部分可拖网海域作为研究区域(图 2)。

|
图 1 渤海设计调查站位和实际调查站位 Fig.1 Designed stations and actual sampling stations in Bohai Sea |

|
图 2 渤海分层随机采样潜在站点分布 Fig.2 Scheme of potential investigation stations for stratified random survey in the Bohai Sea |
数据来源于中国水产科学研究院黄海水产研究所2017年9月渤海底拖网渔业资源调查,调查站位如图 1所示。调查网具网口高度为6 m,网口宽度为22.6 m,网口周长为1740目,网目为63 mm,囊网网目为20 mm,拖速为3 n mile/h,每站拖网时长为1 h。设计站位为60站(图 1中的实心圆圈和空心圆圈),实际拖网为48站(图 1中的实心圆圈)。
为比较不同采样方法及采样站位分配方案,需要获取渔业生物在渤海的“真实”分布。本研究通过GLM和GAM建立生物密度与环境变量(经度、纬度、水深和底质)的关系模型,通过赤池信息准则(Akaike Information Criterion, AIC)选择最优模型,预测了潜在站位的渔业生物密度,以此作为本研究的基础数据。
1.3 采样设计根据历史调查资料,去掉边缘区域和不能进行调查的区域(养殖区),将研究区域划分成0.25°×0.25°采样网格,产生93个潜在调查站点(图 2),根据最优模型(通过AIC值从GLM和GAM中选出最优模型)得到每站的渔业生物资源密度,进行模拟采样。为了方便比较,考虑到以往调查设计为60个站位(图 1中的实心圆圈和空心圆圈),而2017年9月实际调查为48个站位(图 1中的实心圆圈),本研究拟定采样站位数为60个站位和48个站位。
1.3.1 分层随机采样及站位分配方案渔业资源调查中最常用的分层标准是根据影响渔业生物分布的水深、底质、河口、地理区域等地理特征来分层(赵静等, 2014; Xu et al, 2015)。研究证实,渤海渔业生物分布与底质、地理区域、河口、水深等因子密切相关(刘效舜等,1990),本研究根据这4个指标将渤海划分为11层(表 1)。
|
|
表 1 渤海分层描述 Tab.1 Stratum description in the Bohai Sea |
为优化多目标分层随机采样的精度,本研究设置以下3种采样站位分配方案(以此为原则,稍加调整):(1)按站位数为60的定点设计中每层站位比例,分配每层采样站位数;(2)按每层站位数量与潜在站位成正比的原则,分配每层采样站位数;(3)按抽样费用的最优分配准则,分配每层采样站位数。公式如下:
| $ \frac{{{n_h}}}{n} = \frac{{{W_h}{S_h}/\sqrt {{C_h}} }}{{\sum\nolimits_{h = 1}^L {({W_h}{S_h}/\sqrt {{C_h}})} }} $ | (1) |
式中,nh为第h层样本中的单位数,n为样本容量,Wh为第h层的总体权数,Sh为第h层总体标准差,Ch为第h层单个单位所需的调查费用。本研究假设各层调查费用相同,以鱼、虾、蟹和头足类总资源量的每层总体标准差作为Sh。各分配方案每层采样站位数见表 2。
|
|
表 2 各层样本量大小分布 Tab.2 The distribution of the total sample size among strata |
本研究采用包含5个类群资源量指数、17个种类资源量和Margalef丰富度指数(表 3、表 4)来反映采样方案的可接受性。5个类群为鱼类、虾类、蟹类、头足类和其他类;种类考虑了栖息水层、经济价值和生态意义,筛选出17个种类(表 4),按出现率分为3类:Ⅰ类出现率≥70%,包括6个种类;Ⅱ类出现率50%~70%,包括4个种类;Ⅲ类出现率 < 50%,包括7个种类。资源量指数b、资源量B计算公式如下:
| $ b = \sum\limits_{h = 1}^L {\left({\frac{{\sum\limits_{i = 1}^{{n_h}} {{C_{hi}}/a \times {A_{hi}}} }}{{\sum\limits_{i = 1}^{{n_h}} {{A_{hi}}} }} \times {A_h}} \right)} $ | (2) |
| $ B = \sum\limits_{h = 1}^L {\left({\frac{{\sum\limits_{i = 1}^{{n_h}} {{C_{hi}}/{\rm{aq}} \times {A_{hi}}} }}{{\sum\limits_{i = 1}^{{n_h}} {{A_{hi}}} }} \times {A_h}} \right)} $ | (3) |
|
|
表 3 不同站位分配方案中各类群资源量指数和物种多样性指数 Tab.3 Various group biomass index of groups and species diversity index in different station allocation schemes |
|
|
表 4 站位方案优化单种类选择 Tab.4 Select of individual species for the station scheme optimization |
式中,a为每小时的扫海面积,Chi为第h层第i站点拖网渔获量,Ahi为第h层第i站点所属网格面积,nh为第h层样本中的单位数,L为层的总数,Ah为第h层的面积,q为捕捞系数,各种类捕捞系数参考金显仕等(2005)。网格面积使用R语言程序包PBSmapping (Schnute et al, 2015)计算。
本研究采用相对误差(Relative error, REE)比较采样估计值的准确度和精确度(Chen, 1996)。计算公式如下:
| $ {\rm{REE}} = \frac{{\sqrt {\sum\limits_{i = 1}^R {{{(Y_i^e - Y_{}^t)}^2}/R} } }}{{{Y^t}}} \times 100\% $ | (4) |
采用相对偏差(Relative Bias, RB)比较估计量的偏差(Paloheimo et al, 1996)。计算公式如下:
| $ {\rm{RB}} = \frac{{Y_i^e/R - {Y^t}}}{{{Y^t}}} \times 100\% $ | (5) |
式中,Yt为各类群资源量指数、丰富度指数和单种类资源量的“真实”值,Yie为第i次模拟采样的估计值,R为模拟运行次数,本研究中R=100。
1.3.3 模拟过程基于最优模型的预测值,站位数为48和60的分层随机采样借助R语言程序按3种采样站位分配方案进行随机采样,每种方案模拟采样次数为100次,每次均为放回抽样。站位数为48的定点采样采用实际调查的数据,站位数为60的定点采样使用定点设计中的对应站位,从模型预测值中提取数据。
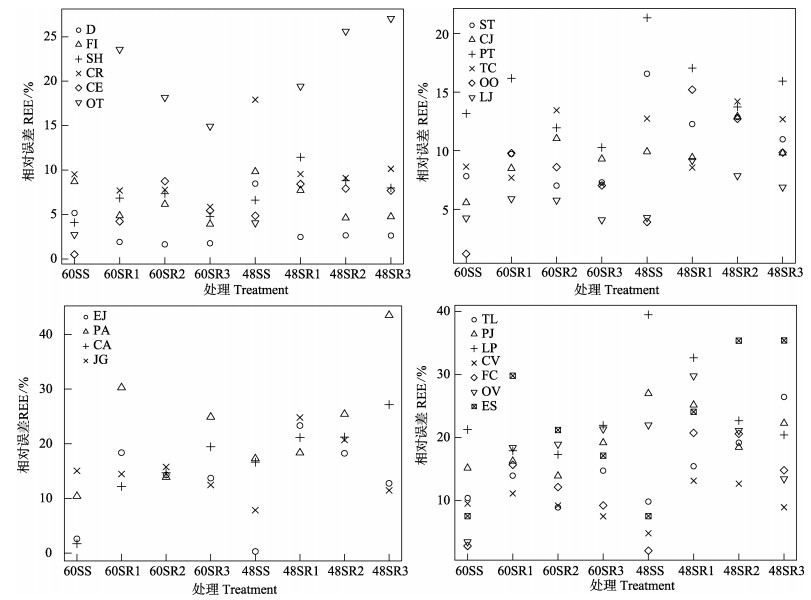
2 结果与分析 2.1 不同采样方案的相对误差比较从类群资源量指数和物种多样性指数(表 3)可以看出,站位数为60的定点采样得到的分析结果相比站位数为48的定点采样更接近于“真实”值;3种采样站位分配方案分层随机采样的资源量评估结果均优于定点采样的评估结果,并且定点采样的资源量评估结果随设计站位数量减少,精度下降,分层随机采样可有效降低取样站位数减少的精度下降。各采样方案中Margalef丰富度指数、鱼类类群和蟹类类群的REE(图 3)随采样站位数减少而增大,分层随机采样REE低于定点采样,3种采样站位分配方案在分层随机采样计算的Margalef丰富度指数和鱼类类群资源量指数的REE均低于定点采样,而分层随机采样计算的虾类、头足类、其他类资源量指数的REE均高于定点采样。
Ⅰ类中5种资源量REE在20%以内,Ⅱ类中3种资源量REE在30%以内,Ⅲ类中6种资源量REE在35%以内(表 5),各种类资源量随种类出现率下降相对误差变大(图 3)。Ⅰ类中,分层随机采样站位分配方案二(SR2)和方案三(SR3)的黄鲫(Setipinna taty)、三疣梭子蟹(Portunus trituberculatus)资源量REE低于定点采样;而短吻红舌鳎(Cynoglossus joyneri)、口虾蛄(Oratosquilla oratoria)资源量REE,3种分配方案的分层随机采样均高于定点采样。Ⅱ类中,各种类资源量REE总体呈现分层随机采样大于定点采样。Ⅲ类中,小黄鱼(Larimichthys polyactis)、泥脚隆背蟹(Carcinoplax vestita)资源量REE分层随机采样大于定点采样,带鱼(Trichiurus lepturus)、鲐鱼(Scomber japonicus)、中国对虾(Fenneropenaeus chinensis)等则呈相反趋势。栖息水层对不同采样方案各种类资源量REE变化无显著的影响。
|
|
表 5 各站位设计方案中单种类资源量 Tab.5 Biomass of individual species for the station scheme optimization |

|
图 3 不同采样设计不同指数的相对误差 Fig.3 The relative estimation error (REE) for different indices of different sampling |
3种站位分配方案的分层随机采样中Margalef丰富度指数REE差异较小,各类群资源量指数中鱼类、虾类、蟹类和头足类在采样站位分配方案三(60SR3和48SR3)中有较小的相对误差,而其他类资源量指数REE在各采样方案中变化较大。Ⅰ类中,黄鲫、口虾蛄、日本枪乌贼(Loligo japonica)资源量在方案三(60SR3和48SR3)中有较小的相对误差,三疣梭子蟹和鹰爪糙对虾(Trachysalambria curvirostris)资源量REE仅在60SR3方案中较小,当采样站位数为48时,在48SR2和48SR1中较小。Ⅱ类中,鳀鱼(Engraulis japonicus)和叫姑鱼(Johnius grypotus)资源量REE在方案三中较小,日本蟳(Charybdis japonica)资源量REE在方案一中较小,银鲳(Pampus argenteus)资源量REE在各采样方案中变化较大。Ⅲ类中,泥脚隆背蟹和中国对虾资源量REE在方案三中较小,长蛸(Octopus variabilis)和小黄鱼资源量REE在48SR3有较小的,海蜇(Rhopilema asculenta)资源量REE在60SR3中较小。综上所述,大部分种类资源量相对误差在方案三中最小,出现率和栖息水层对站位分配方案无明显影响。
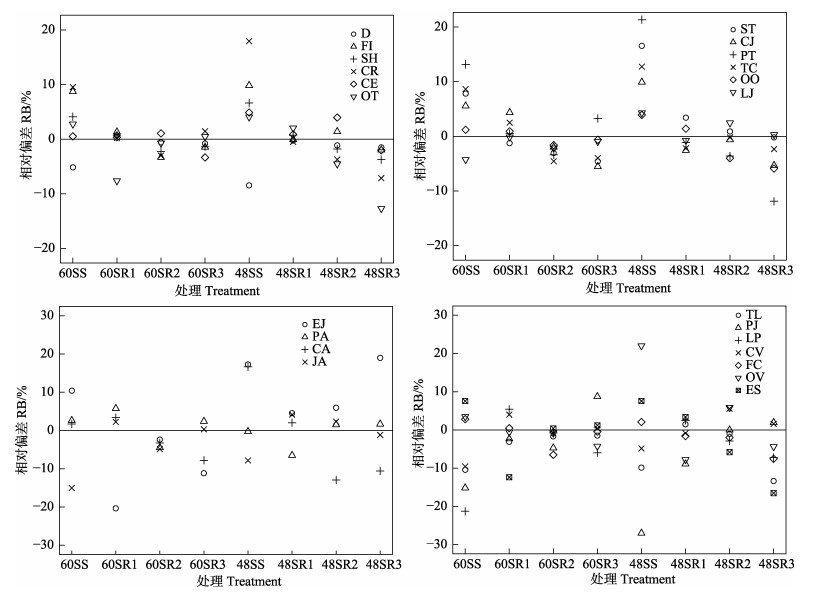
2.2 不同采样方案的相对偏差比较各采样方案计算的各类群资源量指数、各种类资源量和Margalef丰富度指数的相对偏差(RB)均在-10%~10%范围内,无明显变化趋势(图 4),并且上述指数RB绝对值随采样站位数的减少而增大,分层随机采样中3种站位分配方案中各指数RB绝对值总体上小于定点采样。分层随机采样3种站位分配方案的Margalef丰富度指数、鱼类和蟹类资源量指数RB绝对值均小于定点采样,其他类资源量指数RB变化较大。分层随机采样3种站位分配方案中各种类资源量RB绝对值总体上亦小于定点采样。

|
图 4 不同采样设计不同指数的相对偏差 Fig.4 The relative bias (RB) for different indices of different sampling |
本研究通过单种类资源量、类群资源量指数和丰富度指数评估渤海不同采样设计方案,发现每种采样方案均不能同时实现所有评估指数处于最佳值,随机分层采样各评估指数的精度与每层站位的分配方案有直接关系,并且随机分层采样可以减少定点采样因站位数减少造成的各评估指数精度降低。因此,采用随机分层设计调查站位将有助于减少调查成本和保护低丰度的种类,这在赵静等(2014)的研究中也有证实。分层随机采样丰富度指数REE和RB相对较小(图 3,图 4),说明减少样本量和改变采样站位分配方案,分层随机采样仍然可以获得精度较高的丰富度指数,这可能与渔业生物丰富度指数空间差异性较小有关。因此,如以丰富度指数为目标的调查可在随机分层取样中减少调查站位。
合理的采样设计及站位分配方案可提高各评估指数的精度,减少误差(李金昌, 2007),例如,以大西洋鳕(Gadus morhua) (Gavaris et al, 1987)、太平洋鲈鱼(Sebastes alutus) (Lunsford et al, 2001)、西格陵兰虾(Pandalus borealis) (Carlsson et al, 2000; Folmer et al, 2000)为目标种的调查设计研究中发现,优化采样站位分配方案比优化分层能获得更高精度的数据。但不同目标对采样设计和站位分配要求也有差异。本研究表明,对某些目标指数的最优采样站位设计不一定最适合其他目标指数(图 3,图 4),这主要与目标种的空间分布不同有关。例如,本研究方案三(按照抽样费用的最优准则设置站位)使得鱼类、虾类、蟹类、头足类资源量指数和黄鲫、口虾蛄、日本枪乌贼、鳀鱼、叫姑鱼、泥脚隆背蟹、中国对虾资源量评估值精度较高,但日本蟳资源量评估值在方案一中获得最高精度。采样站位数减少也使得某些指数最优方案发生变化,如采样站位为60时,三疣梭子蟹和鹰爪糙对虾资源量在方案三中的评估值精度最高,当采样站位为48时,其资源量评估值在方案二和方案一中精度较高。这表明分层随机采样中最优站位分配方案随调查目标变化而变化,在设计采样方案时,需要对确定目标按照其重要性进行排序,以选出满足相对重要的关键目标,同时对其他目标折衷处理的采样方案。本研究只比较了站位分配方案对多目标指数评估值精度的影响,而没有考虑分层方案的设计及不同季节渔业生物分布的变化。在进一步研究中,需要研究不同季节是否需要不同的分层方案,及分层方案对每层站位分配最优设计的影响,以确定各个季节中最佳分层设计及最佳站位分配方案。
站位优化设计需要渔业生物的“真实”分布,而GLM和GAM的数据要求(Venables et al, 2004)使低丰度物种因数据存在较多零值,在模型拟合中其结果误差较大,而无法得到可靠的推断。GLM和GAM在预测低丰度种类的空间分布时存在较大的缺陷,这可能是导致各种类资源量随种类出现率下降、相对误差变大的原因之一。基于上述存在的问题,很多学者进行了广泛、深入的研究。Thorson等(2015)和Ovaskainen等(2011)通过同时估计稀有种和丰度高种类的分布,从丰度高的种类中“借用”信息估计稀有种类,提高了稀有种类丰度估计值的精确度。这类方法尚未在其他海域及渔业生物中得到验证与广泛应用,但这仍然意味着从多物种分布中提取信息可以是研究低丰度和难以检测到的物种分布的一种有用的方法。未来需要进一步研究如何预测稀有种类分布,筛选优化设计方案的指标,以达到满足渔业资源管理与养护需求,同时降低调查成本和缩短调查时间。
致谢: 中国水产科学研究院黄海水产研究所资源室的老师、同学协助取样,谨致谢枕。
Bian XD, Wan RJ, Jin XS, et al. Ichthyoplankton succession and assemblage structure in the Bohai Sea during the past 30 years since the 1980s. Progress in Fishery Sciences, 2018, 39(2): 1-15 [ 卞晓东, 万瑞景, 金显仕, 等. 近30年渤海鱼类种群早期补充群体群聚特性和结构更替. 渔业科学进展, 2018, 39(2): 1-15] |
Blanchard JL, Maxwell DL, Jennings S. Power of monitoring surveys to detect abundance trends in depleted populations: The effects of density-dependent habitat use, patchiness, and climate change. ICES Journal of Marine Science, 2008, 65(1): 111-120 |
Carlsson D, Kanneworff P, Folmer O, et al. Improving the West Greenland trawl survey for shrimp(Pandalus borealis). Journal of Northwest Atlantic Fishery Science, 2000, 27: 151-160 DOI:10.2960/J.v27.a14 |
Chen Y. A monte Carlo study on impacts of the size of subsample catch on estimation of fish stock parameters. Fisheries Research, 1996, 26(3-4): 207-223 DOI:10.1016/0165-7836(95)00447-5 |
Cochran WG. Sampling techniques. New York: John Wiley & Sons, 1977, 428
|
Folmer O, Pennington M. A statistical evaluation of the design and precision of the shrimp trawl survey off West Greenland. Fisheries Research, 2000, 49(2): 165-178 DOI:10.1016/S0165-7836(00)00196-X |
Gavaris S, Smith SJ. Effect of allocation and stratification strategies on precision of survey abundance estimates for atlantic cod (Gadus morhua) on the eastern Scotian Shelf. Journal of Northwest Atlantic Fishery Science, 1987, 7: 137-144 DOI:10.2960/J.v7.a16 |
Guan WJ, Tian SQ, Wang XF, et al. A review of methods and model selection for standardizing CPUE. Journal of Fishery Sciences of China, 2014(4): 852-862 [ 官文江, 田思泉, 王学昉, 等. CPUE标准化方法与模型选择的回顾与展望. 中国水产科学, 2014(4): 852-862] |
Greenstreet SPR, Piet GJ. Assessing the sampling effort required to estimate α species diversity in the groundfish assemblages of the North Sea. Marine Ecology Progress, 2008, 364(2008): 181-197 |
Jennings S, Kaiser MJ, Reynolds JD. Marine Fisheries Ecology. 2001
|
Jin XS, Dou SZ, Shan XJ, et al. Hot spots of frontiers in the research of sustainable yield of Chinese inshore fishery. Progress in Fishery Sciences, 2015, 36(1): 124-131 [ 金显仕, 窦硕增, 单秀娟, 等. 我国近海渔业资源可持续产出基础研究的热点问题. 渔业科学进展, 2015, 36(1): 124-131] |
Jin XS, Zhao XY, Meng TX, et al. The Yellow Sea and Bohai Sea biological resources and habitats. Beijing: Science Press, 2005: 241-261 [金显仕, 赵宪勇, 孟田湘, 等.黄、渤海生物资源与栖息环境.北京:科学出版社, 2005: 241-261]
|
Keith DM, Hutchings JA. Population dynamics of marine fishes at low abundance. Canadian Journal of Fisheries & Aquatic Sciences, 2012, 69(7): 1150-1163 |
Li JC. Application of sampling techniques. Beijing: Science Press, 2007 [ 李金昌. 应用抽样技术. 北京: 科学出版社, 2007]
|
Li ZY, Wu Q, Shan XJ, et al. Keystone species of fish community structure in the Bohai Sea. Journal of Fishery Sciences of China, 2018, 25(2): 229-236 [ 李忠义, 吴强, 单秀娟, 等. 渤海鱼类群落结构关键种. 中国水产科学, 2018, 25(2): 229-236] |
Lin Q, Wang J, Yuan W, et al. Effects of fishing and environmental change on the ecosystem of the Bohai Sea. Journal of Fishery Sciences of China, 2016, 23(3): 619-629 [ 林群, 王俊, 袁伟, 等. 捕捞和环境变化对渤海生态系统的影响. 中国水产科学, 2016, 23(3): 619-629] |
Liu XS, Wu JN, Han ZG, et al. Fishery resources investigation and regionalization in Bohai District of Yellow Sea. Beijing: China Ocean Press, 1990, 1-22 [刘效舜, 吴敬南, 韩祖光, 等.黄、渤海区渔业资源调查和区划.海洋出版社, 1990, 1-22]
|
Liu Y, Chen Y, Cheng J. A comparative study of optimization methods and conventional methods for sampling design in fishery-independent surveys. ICES Journal of Marine Science, 2009, 66(9): 1873-1882 DOI:10.1093/icesjms/fsp157 |
Lunsford CR, Haldorson L, Fujioka JT, et al. Distribution patterns and survey design considerations of Pacific Ocean perch (Sebastes alutus) in the Gulf of Alaska. In: Kruse GH, Bez N, Booth A, et al., eds. Spatial Processes and Management of Marine Populations. Alaska Sea Grant Program, Fairbanks, 2001, 281-302
|
Ma WW, Wan XQ, Wan K. Interannual variation and formation of wind-driven currents of Bohai Sea in winter. Oceanologia et Limnologia Sinica, 2016, 47(2): 295-302 [ 马伟伟, 万修全, 万凯. 渤海冬季风生环流的年际变化特征及机制分析. 海洋与湖沼, 2016, 47(2): 295-302] |
Miller TJ, Skalski JR, Ianelli JN. Optimizing a stratified sampling design when faced with multiple objectives. Ices Journal of Marine Science, 2007, 64(1): 97-109 DOI:10.1093/icesjms/fsl013 |
Ovaskainen O, Soininen J. Making more out of sparse data: Hierarchical modeling of species communities. Ecology, 2011, 92(2): 289-295 DOI:10.1890/10-1251.1 |
Paloheimo JE, Chen Y. Estimating fish mortalities and cohort sizes. Canadian Journal of Fisheries & Aquatic Sciences, 1996, 53(53): 1572-1579 |
Starr RM, Carr M, Dan M, et al. Complementary sampling methods to inform ecosystem-based management of nearshore fisheries. Marine & Coastal Fisheries, 2010, 2(1): 159-179 |
Scheirer K, Chen Y, Wilson C. A comparative study of American lobster fishery sea and port sampling programs in Maine: 1998-2000. Fisheries Research, 2004, 68(1-3): 343-350 DOI:10.1016/j.fishres.2003.11.003 |
Schnute JT, Boers N, Haigh R. PBS mapping: Mapping fisheries data and spatial analysis tools. 2015. at https://cran.r-project.org/package=PBSmapping
|
Simmonds EJ, Fryer RJ. Which are better, random or systematic acoustic surveys? A simulation using North Sea herring as an example. ICES Journal of Marine Science, 1996, Volume 53(1): 39-50(12) DOI:10.1006/jmsc.1996.0004 |
Smith S, Gavaris S. Improving the precision of abundance estimates of eastern Scotian Shelf Atlantic cod from bottom trawl surveys. North American Journal of Fisheries Management, 1993, 13(1): 35-47 DOI:10.1577/1548-8675(1993)013<0035:ITPOAE>2.3.CO;2 |
Thorson JT, Scheuerell MD, Shelton AO, et al. Spatial factor analysis: A new tool for estimating joint species distributions and correlations in species range. Methods in Ecology & Evolution, 2015, 6(6): 627-637 |
Venables WN, Dichmont CM. GLMs, GAMs and GLMMs: An overview of theory for applications in fisheries research. Fisheries Research, 2004, 69(2): 319-337 |
Xu B, Zhang C, Xue Y, et al. Optimization of sampling effort for a fishery-independent survey with multiple goals. Environmental Monitoring & Assessment, 2015, 187(5): 1-16 |
Zhao J, Zhang SY, Lin J, et al. A comparative study of different sampling designs in fish community estimation. Chinese Journal of Applied Ecology, 2014, 25(4): 1181-1187 [ 赵静, 章守宇, 林军, 等. 不同采样设计评估鱼类群落效果比较. 应用生态学报, 2014, 25(4): 1181-1187] |


