2. 青岛海洋科学与技术试点国家实验室海洋生态与环境科学功能实验室 青岛 266237
2. Pilot National Laboratory for Marine Science and Technology(Qingdao), Laboratory for Marine Ecology and Environmental Science, Qingdao 266237
海洋环境要素是控制鱼类种群分布的重要因子,影响鱼类的生存、生长及繁殖等,环境变动影响鱼类的空间分布和集群(Brander, 2010)。基于生态系统的管理是实现渔业资源可持续发展目标的有效方法(Link, 2002),确认和理解栖息地环境因子如何影响不同空间和时间尺度上鱼类种群的分布模式是其必要组成部分(Martin et al, 2009)。由此,鱼类种群分布与环境关系的研究成为鱼类研究的重要内容之一。
有关鱼类空间分布与环境的关系,研究方法众多,常用的方法有GAM(Generalized additive model)、GLM(Generalized linear model)、QR(Quantile regression)和分类树等。由于GAM模型能解释鱼类分布和环境因子之间的非线性关系,其近年作为生态学空间格局分析的重要方法之一,被广泛用于探究鱼类种群分布的时空特征及其与环境因子关系的研究(陈新军等, 2007; Furey et al, 2013; Grüss et al, 2014; 王浩展等, 2017; 杨胜龙等, 2017)。随着海洋遥感技术的发展,水色、水温遥感数据已被大量用于海洋渔业研究(樊伟, 2004; 丁琪等, 2015; 崔雪森等, 2018)。
鳀(Engraulis japonicus)是一种洄游性小型中上层鱼类,曾是黄、东海生态系统动力学研究的资源关键种(Tang, 2000; Zhao et al, 2003),在海洋生态系统中起着承上启下的重要作用。研究表明,越冬鳀空间分布与水温关系明显(马绍赛, 1987; Kim et al, 2005; 李峣等, 2007; 牛明香等, 2012; Niu et al, 2017)。近年来,在环境变动和过度捕捞的影响下,鳀资源量发生明显变化。本研究基于卫星遥感资料和海上调查数据,在定性分析的基础上,利用GAM模型,定量研究黄海越冬鳀资源密度分布与环境因子的关系,旨在为环境变动下的渔业管理提供科学依据。
1 材料与方法 1.1 数据来源及处理 1.1.1 调查数据调查数据来自“北斗”号调查船2000~2015年(2000、2002~2006、2008、2010~2011、2015)1月在黄海中南部(121°~125.5°E、32°~37°N)的底拖网调查,“北斗”号渔业调查船的网具参数:网具网目836目×20 cm,网口周长为167.2 m,网具总长度为83.2 m,囊网网目2.4 cm。站位布设以经、纬度0.5°×0.5°为一个渔区,各年间站位设置一致。调查按预设站位昼夜进行,各站计划拖网1 h左右,平均拖速3n mile/h,实际拖网时间根据调查时的海况确定,详细记录每个站位的渔获组成、位置等相关信息。本研究提取经纬度、水深、下网时间和鳀渔获重量数据。资源密度以单位捕捞努力量渔获量(CPUE, catch per unit effort)表征,即每网每小时的捕获重量[g/(h·net)]。
1.1.2 遥感数据调查对应时段的水温(SST, sea surface temperature)、叶绿素a(Chl-a)浓度数据来自美国航空航天局(NASA)反演的全球卫星遥感三级数据产品,该数据为月平均数据,空间分辨率为9 km (http://oceancolor.gsfc.nasa.gov)。利用IDL读取原始数据提取研究区(118°~128°E,30°~39°N)的水温、叶绿素a浓度,取1个渔区(0.5°×0.5°)范围内的水温、叶绿素a浓度平均值作为该渔区的值。利用SST计算获得相应渔区的海表温度梯度(TGR, temperature gradient),计算公式如下:
| $ {\rm{TGR}}\left( {^ \circ {\rm{C}}} \right)\sqrt {{{\left( {\frac{{{T_{i + 1}} - {T_{i - 1}}}}{2}} \right)}^2} + {{\left( {\frac{{{T_{j + 1}} - {T_{j - 1}}}}{2}} \right)}^2}} $ |
式中,Ti、Tj为渔区i、j的中心点海表温度。
1.2 研究方法 1.2.1 GIS分析利用ArcGIS地统计分析模块,在进行数据探索的基础上,Kriging插值生成SST、Chl-a和TGR时间系列分布图,并转换成Raster格式;和相应时间段的鳀资源密度分布图叠加,分析越冬鳀资源密度空间分布与环境因子的关系。
1.2.2 GAM模型广义可加模型(GAM)是广义线性模型(GLM)的扩展,是一种非参数化或半参数化的回归分析方法,能很好地模拟响应变量和一个或多个预测变量之间的关系(Hastie et al, 1990)。本研究采用GAM模型分析各时空和环境因子对鳀资源密度的非线性影响。由于调查中“零”渔获站位的出现,一般对CPUE加上一个常数,本研究中对所有CPUE加上常数1后取对数,构建的GAM模型如下:
ln(CPUE+1)=s(Year)+s(Hour)+s(Longitude)+s(Latitude)+s(SST)+s(Depth)+s(TGR)+s(Chl-a), family=gaussian
式中,Year表示年份,Hour表示下网时间,Longitude表示经度,Latitude表示纬度,SST表示海表温度,Depth表示水深,TGR表示海水温度梯度,Chl-a表示叶绿素a浓度。模型变量选择基于模型因子的显著性(P < 0.05),模型选择采用赤池信息量准则(AIC, Akaike information criterion),将解释变量随机逐个加入GAM模型,得到包含不同因子的模型,AIC值最小者为最佳模型(Damalas et al, 2007)。
受其他因素的影响,有些对鱼类分布影响较大的环境变量有可能对CPUE影响不显著,对该类型变量根据实际情况进行处理。
数据分析利用ArcGIS 10.2、SPSS 17.0和S-plus 8.0软件完成。
2 结果 2.1 越冬鳀时空分布与海洋环境因子的关系由图 1A所知,越冬鳀分布的温度范围较广,从2~17℃都有分布,但高资源密度区主要分布在7~13℃的海域内,且集中在暖水舌及以东的区域。图 1B所示,越冬鳀分布在低叶绿素a浓度海域内,主要范围为0.5~2.5 mg/m3。2000~2015年,越冬鳀分布的温度梯度范围略有变化,2005年开始,鳀分布区域内有高温度梯度水团出现,但纵观所有年份,越冬鳀主要分布在低温度梯度海域,分布范围为0.5~4℃(图 1C)。

|
图 1 黄海越冬鳀资源密度和环境因子SST、Chl-a和TGR的空间分布 Fig.1 Spatial distribution of stock density of wintering anchovy and environmental factors such as SST, Chl-a and TGR in the Yellow Sea |
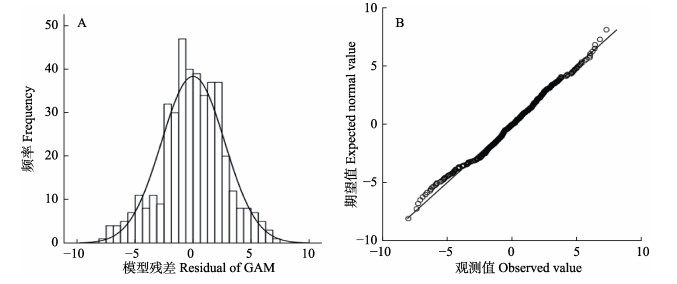
GAM模型的残差分布及其正态Q-Q图(Quantile-Quantile)常用来检验模型分布假设。图 2A显示,模型残差服从正态分布;图 2B的正态Q-Q曲线分布表明,残差值集中于对角线上并呈线性分布,表明残差趋向于服从均值为零的正态分布;二者均表明GAM模型的分布假设比较合适。

|
图 2 GAM模型残差的频次分布及正态Q-Q图 Fig.2 Distribution and normal Q-Q plot of residuals in GAM model |
依次将各个解释变量逐一加入模型中,每一行表明了加入该因子后解释变量对模型的贡献信息。由表 1可知,年份、下网时间、经度、纬度、温度和水深均为显著性变量,对越冬鳀资源密度分布影响显著,卡方检验P < 0.05;而温度梯度虽然非参数化影响不显著[Pr(Chi) > 0.05],但加入模型后,F检验P < 0.05,且对模型总偏差解释率大于SST,因此,将温度梯度同样作为显著性因子;叶绿素a浓度对越冬鳀资源密度分布影响不显著,卡方检验、F检验均P > 0.05,但模型加入该因子后,AIC值持续变小,且叶绿素a浓度对越冬鳀的分布也有一定的影响,因此,该变量仍保留在模型中。该模型对CPUE的总偏差解释为44.76%,其中,经度和纬度对CPUE的影响最为显著,分别解释了22.76%和12.64%的偏差;年份、温度梯度、下网时间、水深、温度对CPUE的影响次之,叶绿素a浓度对CPUE的影响最小,解释了0.51%的偏差。
|
|
表 1 GAM模型拟合结果的偏差分析及显著性因子选择 Tab.1 Summary analysis of deviance for generalized additive models (GAM) and the obvious factors selection |
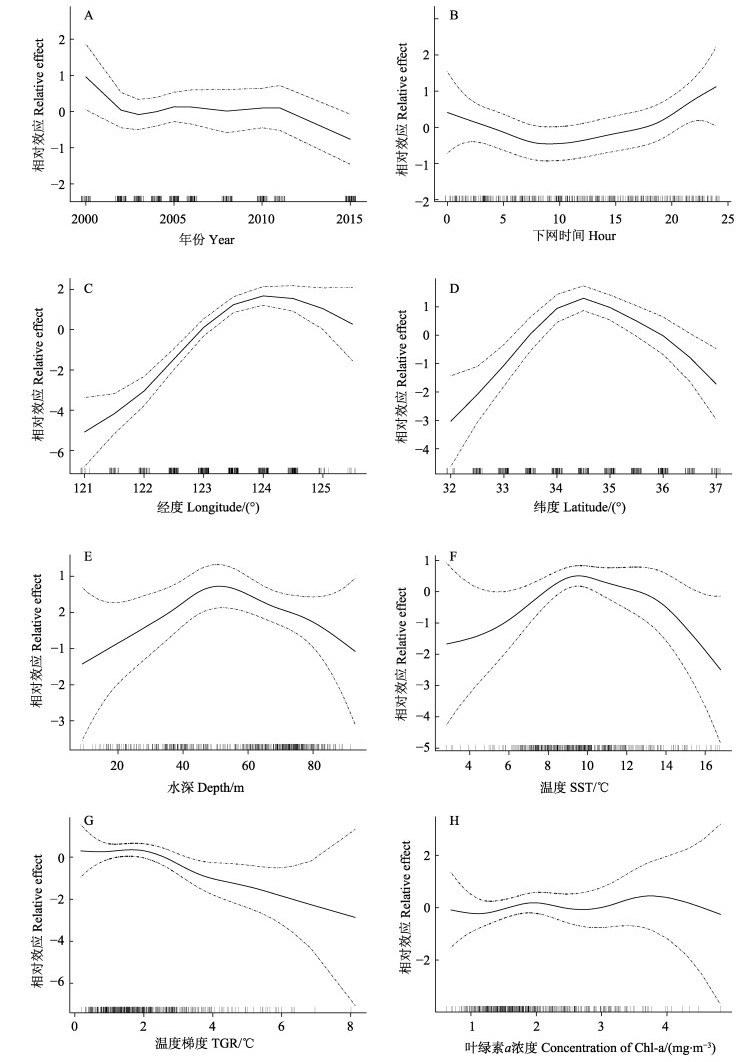
图 3为各因子对越冬鳀资源密度分布的影响。时间效应方面,越冬鳀资源密度年间变化较大(图 3A),2000~2015年,资源密度总体呈下降趋势;2000~2002年,资源密度迅速下降;2002~2011年,资源密度年间有差异,但变化幅度较小;2011~2015年,资源密度下降明显。由下网时间与越冬鳀资源密度的关系可以看出(图 3B),0:00~ 07:00资源密度呈下降趋势,之后处在稳定和缓慢上升的阶段,大约19:00左右,资源密度开始明显上升。

|
图 3 时空和环境因子对黄海越冬鳀资源密度分布的影响 Fig.3 Impacts of spatio-temporal and oceanographic variables on stock density of wintering anchovy derived from the GAM analysis in the Yellow Sea |
空间效应方面,资源密度随经度和纬度变化剧烈。越冬鳀主要分布在122°~124.5°E之间,在124°E以西海域,资源密度和经度呈明显的正相关关系;在124°E以东海域,资源密度和经度呈负相关(图 3C)。越冬鳀集中分布在33°~36°N之间,在34.5°N以南的海域,随着纬度升高,资源密度迅速上升;而在34.5°N以北海域,随着纬度升高,资源密度快速下降(图 3D)。
环境效应方面,越冬鳀资源密度主要集中于60~80 m水深范围内,但水深的影响以大约50 m为分界点,在50 m以浅的水域,随着水深的增加,资源密度升高;而在50 m以深的水域,变化趋势则相反(图 3E)。在7~11℃内,越冬鳀集中分布,水温低于9.5℃时,资源密度与其呈正相关;水温高于9.5℃时,资源密度与其呈负相关(图 3F)。越冬鳀主要分布在温度梯度0.7~2.5℃内,资源密度处于平稳阶段,随着温度梯度增大,达到2℃后,资源密度明显下降(图 3G)。在不同范围内,叶绿素a浓度对资源密度的影响不同,二者之间的关系比较复杂,正相关和负相关交替变化,但总体来看,越冬鳀集中分布在叶绿素a浓度1.2~2.3 mg/m3之间(图 3h)。
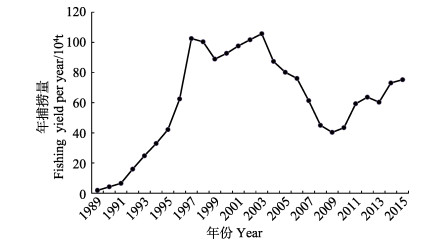
3 分析与讨论 3.1 越冬鳀的时空分布特征2000~2015年,越冬鳀资源密度呈下降趋势,其中,2002~2011年资源密度年间波动不大,但2000~ 2002年和2011~2015年均明显下降。20世纪90年代以前,黄海鳀资源尚未进行规模化开发,之后鳀渔业经过快速发展,在连续几年超过百万吨的捕捞压力下,2003年1月调查发现,资源密度出现历史最低记录,资源接近崩溃边缘(赵宪勇, 2006)。本研究GAM模型结果表明,自2000年开始,2003年资源密度处在最低水平,与上述研究结果一致。鱼类资源密度的影响因素众多,但捕捞压力是最主要的因素,决定鳀的资源丰度。黄渤海鳀年捕捞量(图 4)显示,1989~ 1997年,鳀捕捞产量快速上升,之后两年略有下降,但自1999年开始,捕捞量又开始增加,2003年达到最高值;GAM模型结果显示,2000~2003年资源密度逐年下降(图 3)。自2003年开始,捕捞量快速下降,2009年达到最低,2010年基本持平,之后又明显上升(图 4);2004~2011年期间,鳀资源密度存在年间波段,但总体看来,2010年和2011年呈上升趋势,而2015年却快速下降(图 3)。资源密度与捕捞量的关系充分印证了捕捞压力对鳀资源密度的影响。

|
图 4 黄渤海鳀年捕捞量(数据来源:中国渔业统计年鉴) Fig.4 Fishing yield per year of anchovy in the Yellow Sea and Bohai Sea (Data source: China Fishery Statistics Yearbook) |
GAM结果表明,调查捕获的鳀资源密度一天之内变化明显,白天所捕获的资源密度较夜间稳定,且从白天到夜晚,资源密度不断升高,而从夜晚到白天,资源密度逐渐下降。这是因为冬季受强烈北风的影响,水层垂直混合作用明显,黄海水域基本无温跃层出现(邹娥梅, 2001; 葛人峰等, 2006)。鳀垂直分布昼夜变化明显,在无温跃层水域,白天常分布于中下层或近底层,且易集成小群;夜间则主要分散分布于中层至中上水层(马绍赛, 1989; 赵宪勇, 2006)。林德芳(1997)研究显示,对于鳀的不同集群模式,其集群密度不同,中层型高于近底层型,近底层型高于表层型。因此,白天到夜间,鳀的集群模式由近底层型转变为中层型,资源密度不断升高;夜间到白天,则反之。
黄海暖流对黄海越冬鳀的分布有重要影响,越冬鳀主要密集于黄海暖流入侵所形成的暖水舌边缘(陈聚法, 1997; 李峣等, 2007),图 1A中鳀的分布与其相符。GAM分析显示,经纬度对越冬鳀资源密度影响最大,贡献率占模型总贡献率的79%。在124°E以西海域,越冬鳀资源密度随经度升高而快速上升;而在124°E以东海域,由于调查数据减少,数据相关性变差。在纬度分布上则以34.5°N为分界线,34.5°N以南的海域,越往北,资源密度越高;而34.5°N以北海域,越往北,资源密度越低,且变化明显。赵宪勇(2006)的研究表明,越冬期间不同大小个体鳀的分布有明显的区域特征,大个体鳀主要分布于123°E以东海域,而小个体则主要分布于调查水域的北部和西部,以西部浅水区为主。本研究结果与其一致。
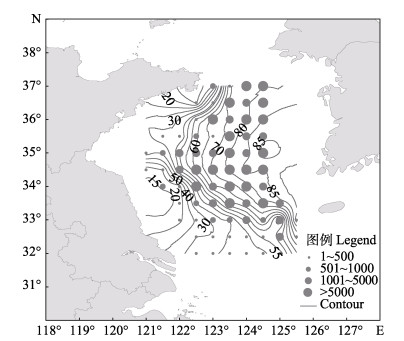
3.2 越冬鳀分布与环境因子的关系越冬鳀资源密度分布与水深关系密切,模型贡献率为1.47%。与其他因子不同的是,虽然资源密度主要集中在水深60~80 m范围内,但水深对资源密度的影响却以大约50 m为界。由图 5可知,从浅水区到深水区,资源密度逐渐增大,因此,在浅于50 m的水域内,水深与资源密度呈正相关。随着水深的继续增加,每个调查站位的资源密度没有降低;但由于GAM结果表现的是一种相对效应,随着水深增加,该深度范围内的站位数量减少,因此,总体看来,深于50 m的水域,资源密度随水深增加而降低。

|
图 5 越冬鳀资源密度与水深等值线分布[g/(h·net)] Fig.5 Map of wintering anchovy stock density and water depth contour [g/(h·net)] |
水温对越冬鳀资源密度分布影响显著,越冬鳀密集分布在7~11℃范围内;小于9.5℃时,资源密度随温度升高而增加;大于9.5℃后,资源密度随温度升高而降低。这是因为水温是鱼类生活环境中最基本最重要的因素,其变化对鱼类的生活、生长及饵料的生长均产生影响,这直接或间接地影响着鱼类资源量的分布。鳀作为小型中上层鱼类,对水温变化敏感(李向心, 2007),海水温度的变化影响着越冬鳀的纬向分布(牛明香等, 2012; 陈云龙, 2014; Niu et al, 2017)。马绍赛(1989)和李峣等(2007)的研究表明,越冬鳀的适温范围为8~15℃,密集分布区为11~13℃,本研究结果略有差异。这是因为鱼类不同生活史阶段适温范围不同(Bellido et al, 2001),种群大小、年龄结构和捕捞状况等均影响越冬鳀的分布(Loots et al, 2010)。本研究所用为2000~2015年数据,时间跨度大,前期研究数据分别为1985~1987年和2002~2003年;随着捕捞压力的变化,黄海越冬鳀的年龄结构变化明显(赵宪勇, 2006; 张俊, 2011),因此,适温范围有所差异。
越冬鳀的高资源密度区主要分布在温度梯度相对小的区域内(图 1C)。GAM结果表明,越冬鳀主要分布在大约0.7~2.5℃的温度梯度范围内。在适宜的范围内,随着温度梯度增大,越冬鳀资源密度由基本稳定到明显下降。这是因为越冬鳀主要密集分布于黄海暖流暖水舌边缘(李峣等, 2007),该区域温度梯度不大;而在温度梯度大的浅水区域,则主要分布着小个体鳀鱼(赵宪勇, 2006)。
4 结论越冬鳀资源密度分布与环境因子关系密切,资源密度集中分布在一定的海表温度、叶绿素a浓度和海表温度梯度范围内。GAM定量分析表明,年份、下网时间、经度、纬度、水深、温度和温度梯度对越冬鳀资源密度分布影响显著。2000~2015年,越冬鳀资源密度总体呈下降趋势,年间波动明显,个别年份资源密度呈上升趋势;下网时间对捕获的鳀资源密度影响明显,从白天到夜晚,资源密度逐渐升高,而从夜晚到白天,资源密度不断降低;调查范围内,经度对资源密度的影响以124°E为界,纬度对资源密度的影响则以34.5°N为界,两端呈现相反的变化趋势;50 m以浅的水域,资源密度随水深增加而增加,50 m以深的水域,资源密度随水深增加而降低;越冬鳀集中分布在7~11℃范围内,水温明显影响着资源密度的变化趋势;最适宜的海水温度梯度和叶绿素a浓度分别为0.7~2.5℃和1.2~2.3 mg/m3。
致谢: 感谢中国水产科学研究院黄海水产研究所资源室成员及“北斗号”全体船员在野外调查取样过程中给予的帮助。
Bellido JM, Pierce GJ, Wang J. Modelling intra-annual variation in abundance of squid Loligo forbesi in Scottish waters using generalized additive models. Fisheries Research, 2001, 52(1): 23-29 |
Brander K. Impacts of climate change on fisheries. Journal of Marine Systems, 2010, 79(3-4): 389-402 DOI:10.1016/j.jmarsys.2008.12.015 |
Chen JF. Variation characteristics of three large water systems influencing the behavior and distribution of anchovy Engraulis japonicus in the Yellow Sea and East China Sea in autumn and winter. Marine Fisheries Research, 1997, 18(1): 54-59 [陈聚法. 秋冬季黄东海区影响鳀鱼行动分布的三大水系变化特征. 海洋水产研究, 1997, 18(1): 54-59] |
Chen XJ, Tian SQ. Effects of SST and temp-spatial factors on abundance of nylon flying squid Ommastrephes bartrami in the Northwestern Pacific using generalized additive models. Transactions of Oceanology and Limnology, 2007(2): 104-112 [陈新军, 田思泉. 利用GAM模型分析表温和时空因子对西北太平洋海域柔鱼资源状况的影响. 海洋湖沼通报, 2007(2): 104-112 DOI:10.3969/j.issn.1003-6482.2007.02.016] |
Chen YL. Interannual variation in population characteristics of anchovy (Engraulis japonicus) and redistribution of its wintering stock under climate change scenarios in the Yellow Sea. Master's Thesis of Ocean University of China, 2014 [陈云龙.黄海鳀鱼种群特征的年际变化及越冬群体的气候变化情景分析.中国海洋大学硕士研究生学位论文, 2014] http://cdmd.cnki.com.cn/Article/CDMD-10423-1014203831.htm
|
Cui XS, Zhou WF, Tang FH, et al. The construction of habitat suitability index forecast model of Ommastrephes bartramii fishing ground based on constrained linear regression. Progress in Fishery Sciences, 2018, 39(1): 64-72 [崔雪森, 周为峰, 唐峰华, 等. 基于约束线性回归的柔鱼栖息地指数渔场预报模型构建. 渔业科学进展, 2018, 39(1): 64-72] |
Damalas D, Megalofonou P, Apostolopoulou M. Environmental, spatial, temporal, and operational effects on swordfish (Xiphias gladius) catch rates of eastern Mediterranean Sea longline fisheries. Fisheries Research, 2007, 84(2): 223-246 |
Ding Q, Chen XJ, Wang JT. Comparison habitat suitability index model of Illex argentinus and its application into fishing ground forecasting. Progress in Fishery Sciences, 2015, 36(3): 8-13 [丁琪, 陈新军, 汪金涛. 阿根廷滑柔鱼(Illex argentinus)适宜栖息地模型比较及其在渔场预报中的应用. 渔业科学进展, 2015, 36(3): 8-13] |
Fan W. A study on application of satellite remote sensing in marine fishing-ground analysis and fishing condition forecasting-A case of Ommastrephes bartrami fisheries in Northwest Pacific Ocean. Doctoral Dissertation of East China Normal University, 2004 [樊伟.卫星遥感渔场渔情分析应用研究——以西北太平洋柔鱼渔业为例.华东师范大学博士研究生学位论文, 2004] http://cdmd.cnki.com.cn/article/cdmd-10269-2004087221.htm
|
Furey NB, Rooker JR. Spatial and temporal shifts in suitable habitat of juvenile southern flounder (Paralichthys lethostigma). Journal of Sea Research, 2013, 76: 161-169 DOI:10.1016/j.seares.2012.08.007 |
Ge RF, Guo JS, Yu F, et al. Classification of vertical temperature structure and thermocline analysis in the Yellow Sea and East China Sea shelf sea areas. Advances in Marine Science, 2006, 24(4): 424-435 [葛人峰, 郭景松, 于非, 等. 黄、东海陆架海域温度垂直结构类型划分与温跃层分析. 海洋科学进展, 2006, 24(4): 424-435 DOI:10.3969/j.issn.1671-6647.2006.04.003] |
Grüss A, Drexler M, Ainsworth CH. Using delta generalized additive models to produce distribution maps for spatially explicit ecosystem models. Fisheries Research, 2014, 159: 11-24 DOI:10.1016/j.fishres.2014.05.005 |
Hastie T, Tibshirani R. Generalized additive models. London: Chapman and Hall, 1990, 352
|
Kim JY, Kang YS, Oh HJ, et al. Spatial distribution of early life stages of anchovy (Engraulis japonicus) and hairtail (Trichiurus lepturus) and their relationship with oceanographic features of the East China Sea during the 1997-1998 EI Niño Event. Estuarine, Coastal and Shelf Science, 2005, 63: 13-21 DOI:10.1016/j.ecss.2004.10.002 |
Li XX. Study on individual-based model of anchovy population dynamics in the Huanghai Sea and Bohai Sea. Doctoral Dissertation of Ocean University of China, 2007 [李向心.基于个体发育的黄渤海鳀鱼种群动态模型研究.中国海洋大学博士研究生学位论文, 2007] http://cdmd.cnki.com.cn/article/cdmd-10423-2008010911.htm
|
Li Y, Zhao XY, Zhang T, et al. Wintering migration and distribution of anchovy in the Yellow Sea and its relation to physical environment. Marine Fisheries Research, 2007, 28(2): 104-112 [李峣, 赵宪勇, 张涛, 等. 黄海鳀鱼越冬洄游分布及其与物理环境的关系. 海洋水产研究, 2007, 28(2): 104-112] |
Lin DF. Studies on the distribution pattern of Japanese anchovy in Yellow Sea and East China Sea. Journal of Fisheries of China, 1997, 21(1): 44-48 [林德芳. 东、黄海鳀鱼集群分布模式的研究. 水产学报, 1997, 21(1): 44-48] |
Link JS. Ecological considerations in fishery management:When does it matter?. Fisheries, 2002, 27: 10-17 |
Loots C, Vaz S, Planque B, et al. What controls the spatial distribution of the North Sea plaice spawning population?Confronting ecological hypotheses through a model selection framework. ICES Journal of Marine Science, 2010, 67(2): 244-257 DOI:10.1093/icesjms/fsp238 |
Ma SS. Relationship between distribution and hydrological conditions of the wintering anchovy in Yellow Sea and East China Sea. Journal of Fisheries of China, 1989, 13(3): 201-206 [马绍赛. 黄、东海越冬鳀鱼的分布与水温条件的关系. 水产学报, 1989, 13(3): 201-206] |
Martin CS, Carpentier A, Vaz S, et al. The channel habitat atlas for marine resource management (CHARM):An aid for planning and decision-making in an area under strong anthropogenic pressure. Aquatic Living Resources, 2009, 22: 499-508 DOI:10.1051/alr/2009051 |
M SS. The hydrologic characteristics of the southern Huanghai Sea and East China Sea during winter and their relations to fishing grounds of anchovy. Marine Forecasts, 1987, 4(4): 37-44 [马绍赛. 南黄海和东海冬季水文状况及其与鳀鱼渔场的关系. 海洋预报, 1987, 4(4): 37-44] |
Niu MX, Wang J. Variation in the distribution of wintering anchovy Engraulis japonicas and its relationship with water temperature in the central and southern Yellow Sea. Chinese Journal of Oceanology and Limnology, 2017, 35(5): 1134-1143 DOI:10.1007/s00343-017-6134-1 |
Niu MX, Li XS, Zhao GX. Spatial distribution of wintering anchovy Engraulis japonicas and its relationship with the inter-annual variations of water temperature in central and southern Yellow Sea. Chinese Journal of Applied Ecology, 2012, 23(2): 552-558 [牛明香, 李显森, 赵庚星. 黄海中南部越冬鳀鱼空间分布及其与水温年际变化的关系. 应用生态学报, 2012, 23(2): 552-558] |
Tang QS. The new age of China-GLOBEC study. Newsletter of the North Pacific Marine Science Organization, 2000, 8(1): 28-29 |
Wang HZ, Dai XJ, Guan WJ, et al. Relationship between the environmental factors and the CPUE (catch per unit) of Pseudocarcharias kamoharai in tropical Atlantic Ocean based on the GAM-Tweedie model. Chinese Journal of Applied Ecology, 2017, 28(6): 2024-2031 [王浩展, 戴小杰, 官文江, 等. 基于Tweedie-GAM模型的热带大西洋拟锥齿鲨单位捕捞努力量渔获量与环境因子的关系. 应用生态学报, 2017, 28(6): 2024-2031] |
Yang SL, Zhang BB, Tang BJ, et al. Influence of vertical structure of the water temperature on bigeye tuna longline catch rates in the tropical Atlantic Ocean. Journal of Fishery Science of China, 2017, 24(4): 875-883 [杨胜龙, 张忭忭, 唐宝军, 等. 基于GAM模型分析水温垂直结构对热带大西洋大眼金枪鱼渔获率的影响. 中国水产科学, 2017, 24(4): 875-883] |
Zhang J. Estimation of the anchovy resources in the Yellow Sea based on acoustic data post-processing system. Master's Thesis of Shanghai Ocean University, 2011 [张俊.基于声学数据后处理系统的黄海鳀鱼资源声学评估.上海海洋大学硕士研究生学位论文, 2011] http://kns.cnki.net/KCMS/detail/detail.aspx?dbcode=CMFD&filename=1011305083.nh
|
Zhao X, Hamre J, Li F, et al. Recruitment, sustainable yield and possible ecological consequence of the sharp decline of the anchovy (Engraulis japonicus) stock in the Yellow Sea in the 1990s. Fisheries Oceanography, 2003, 12(4-5): 495-501 DOI:10.1046/j.1365-2419.2003.00262.x |
Zhao XY. Population dynamic characteristics and sustainable utilization of the anchovy stock in the Yellow Sea. Doctoral Dissertation of Ocean University of China, 2006 [赵宪勇.黄海鳀鱼种群动力学特征及其资源可持续利用.中国海洋大学博士研究生学位论文, 2006] http://cdmd.cnki.com.cn/Article/CDMD-10423-2006181472.htm
|
Zou EM, Xiong XJ, Guo BH, et al. Characteristics and seasonal variations of the thermocline and halocline in the Huanghai Sea and East China Sea. Journal of Oceanography of Huanghai and Bohai Seas, 2001, 19(3): 8-18 [邹娥梅, 熊学军, 郭炳火, 等. 黄、东海温盐跃层的分布特征及其季节变化. 黄渤海海洋, 2001, 19(3): 8-18 DOI:10.3969/j.issn.1671-6647.2001.03.002] |


