2. 福建省海洋生物遗传育种重点实验室(厦门大学) 福建 厦门 361102
2. Fujian Key Laboratory of Genetics and Breeding of Marine Organisms (Xiamen University), Xiamen, Fujian 361102, China
近年来,随着水产养殖业与渔业贸易的深度发展,各地区经济鱼类养殖出现互融互通的发展新模式,近交、迁徙、过度捕捞、养殖种群逃逸等因素对各地区鱼类种群结构产生了深刻的影响。种质鉴定能反映鱼类种群资源状况,查明原始种群与养殖种群的遗传结构和变异情况,从而确定原种保护和开发利用措施。伴随着鱼类种群遗传学的发展,种群鉴定已由形态学鉴别发展到蛋白质和DNA分子水平(李瑶瑶等, 2017)。
花鲈(Lateolabrax maculatus)俗名鲈鱼、七星鲈、寨花等,广泛分布于我国沿海以及朝鲜沿海,是我国重要的海产经济鱼类。花鲈具有广温、广盐性的特性,在海淡水中均适合养殖,为南北方沿海网箱及池塘养殖的主要对象之一,养殖规模逐步扩大(温海深等, 2016; 孙敬诚等, 2021)。自20世纪80年代,基于形态学的特征,中国花鲈和日本真鲈(L. japonicus)被划分为一个属(Futuyma et al, 1980)。2001年,中国花鲈被命名为L. maculatus (Kim et al, 2001)。相比于日本真鲈受地理区域的限制,中国花鲈分布更广泛,南到中国–印度半岛,北到渤海湾(Zhao et al, 2017)。中国花鲈种质资源构成较为复杂,由于自然迁移和外部地理环境等原因,形成众多不同的地理群体。关于花鲈群体遗传结构研究多有报道,包括基于随机扩增多态DNA(RAPD)技术及微卫星DNA标记的分析(胡自民等, 2007; 江鑫等, 2009)、细胞色素b基因和控制区域的分析(Liu et al, 2006)、线粒体基因组分析(Shan et al, 2016; Gong et al, 2020)等。
随着高通量测序技术的快速发展,许多高效快捷的工具用于全基因组范围内的种群遗传研究,包括简化基因组测序(reduced-representation sequencing)技术。近年来,越来越多的养殖者认为,源自黄、渤海的花鲈苗种生长快、抗病性强,日本、韩国及广东、福建等花鲈养殖地区大量购买中国北方花鲈苗种来进行人工养殖(楼东等, 2000)。北方地区花鲈苗种的大量推广养殖,导致中国不同地区的花鲈群体种质愈加不清晰。本研究在Zhao等(2017)对中国自然海域12个花鲈野生群体遗传结构分析结果的基础上,利用ddRAD (double-digested restriction-site associated DNA)简化基因组测序技术对我国花鲈养殖群体进行遗传结构分析,以期对我国花鲈主要养殖地区的种质来源进行鉴定区分,为后续的花鲈品种选育工作提供依据。
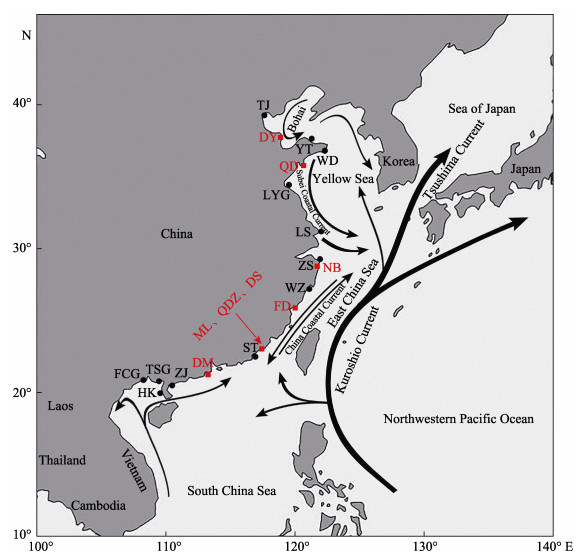
1 材料与方法 1.1 实验材料实验样品采自山东(青岛市黄岛区积米崖港、东营市利津县双瀛水产苗种有限责任公司)、浙江(宁波市奉化进出口有限公司)、福建[福鼎市闽威实业股份有限公司、诏安县(梅岭镇悬钟村、桥东镇溪雅村)、东山县(杏陈镇大产村)]和广东(斗门区河口渔业研究所)(图 1)。诏安县样本规格为鱼苗,其他样本均为幼鱼,分别命名为QD、DY、NB、FD、ML、QDZ、DS和DM。上述地区采集的样本数共计86个(表 1)。采用200 mg/L的MS-222将花鲈麻醉后,取腹部鳍条,保存于装有无水乙醇的1.5 mL的离心管中。在采集鳍条后,分别于3 h、6 h、24 h、72 h、7 d、30 d更换无水乙醇,以保证样品DNA的质量。

|
图 1 花鲈野生群体和养殖群体取样点[修改自Zhao等(2017)] Fig.1 Map of sampling location of wild and cultured spotted sea bass populations (Modified from Zhao et al, 2017) 图中红色字母表示养殖花鲈群体(QD:青岛;DY:东营;NB:宁波;FD:福鼎;ML:梅岭镇;QDZ:桥东镇;DS:东山县;DM:斗门);黑色字母表示野生花鲈群体(TJ:天津;YT:烟台;WD:文登;LYG:连云港;LS:吕四;ZS:舟山;WZ:温州;ST:汕头;ZJ:湛江;HK:海康港;TS:铁山港;FC:防城港)。下同 The red letters in the figure show the cultured spotted sea bass populations (QD: Qingdao; DY: Dongying; NB: Ningbo; FD: Fuding; ML: Meiling; QDZ: Qiaodong; DS: Dongshan; DM: Doumen); the wild spotted sea bass populations are showed in the black letters (TJ: TianJin; YT: Yantai; WD: Wendeng; LYG: Lianyungang; LS: Lüsi; ZS: Zhoushan; WZ: Wenzhou; ST: Shantou; ZJ: Zhanjiang; HK: Haikanggang; TS: Tieshangang; FC: Fangchenggang). The same as below |
|
|
表 1 用于构建ddRAD文库的花鲈养殖群体样品数 Tab.1 Number of samples of cultured spotted sea bass populations used to construct ddRAD library |
花鲈基因组DNA采用传统的酚–氯仿法提取。将切碎的组织与500 μL细胞裂解液和20 μL蛋白酶K (20 mg/mL)在56℃条件下裂解2 h (期间每隔0.5 h混匀一次,直至离心管中液体彻底澄清),然后在37℃条件下加入2 μL RNaseA(100 mg/mL),反应30 min。随后用等体积的Tris-平衡酚分离蛋白质和DNA,并用等量的氯仿/异丙醇混合溶液(24∶1)再次提取DNA。在–20℃条件下沉淀2 h,离心收集基因组DNA,用70%乙醇洗涤2次,晾干,并重悬溶解于20~80 μL DEPC水中。随后,使用NanoDrop2000 (Thermo Fisher, Waltham, 美国)对样品DNA浓度进行测定,合格DNA样品A260/280和A260/230值分别在1.8~2.0、2.0~2.2范围。再用1.0%琼脂糖凝胶电泳检测基因组DNA完整度。DNA样品–20℃保存备用。
1.3 ddRAD文库构建ddRAD文库制备方法参照Peterson等(2012)的研究。简言之,用EcoRⅠ-HF和MspⅠ消化每尾鱼的2.5 μg基因组DNA。将带有正向扩增引物和barcode并与EcoRⅠ-HF酶切位点连接的P1接头以及带有反向扩增引物并与MspI酶切位点连接的P2接头进行连接,然后通过PCR进行检测。随后将86个样品混合为4份,加入AmpureXP磁珠(Beckman A63881)进行纯化,采用E-Gel系统(Invitrogen G6500和G6400)电泳,回收255~430 bp的DNA片段。随后进行30个循环的Index PCR扩增。利用AxyPrep DNA凝胶回收试剂盒(Axygen AP-GX-50G)回收PCR目的片段。本实验共建立4个ddRAD文库,经Agilent 2100生物芯片分析系统检测合格后,采用150 bp paired-end策略使用Illumina HiSeq X Ten平台进行测序。
1.4 SNP位点挖掘及分型依据不同个体特殊的barcode-index组合,利用Stacks v1.46 (Catchen et al, 2011、2013)软件对clean reads数据进行个体区分。过滤去掉质量低的reads (quality score < 10)和模糊不清的RAD-Tag,删除每条reads 130 bp以后的序列,允许碱基错配数为1。自NCBI数据库中下载花鲈基因组数据(GenBank No.: GCA_004028675.1),使用BWA软件(Li et al, 2010)将分析个体的RAD-tags与花鲈基因组进行比对,转化生成文件。然后按照Stacks的标准流程进行SNP挖掘(Catchen et al, 2013)。利用PLINK软件过滤掉不符合要求的SNP位点,0.05作为最小等位基因频率的阈值(Purcell et al, 2007),保留下来的位点需在超过80%的分析个体中都分型成功。
1.5 群体遗传结构分析对以上养殖群体样本测序分型,得到23, 258个SNP分型。结合Zhao等(2017)对12个花鲈野生群体[渤海湾(天津TJ和烟台YT)、黄海(文登WD、连云港LYG和吕四LS)、东海(舟山ZS和温州WZ)、南海(汕头ST和湛江ZJ)和北部湾(海康港HKG、铁山港TSG和防城港FCG)]成功分型的SNPs信息,对20个花鲈群体遗传结构进行分析。
1.5.1 主成分分析使用SNPRelate R软件包(Zheng et al, 2012)中的snpgdsVCF2GDS函数进行主成分分析(principal component analysis, PCA)。使用snpgdsPCA函数计算特征向量的值。采用Galinsky等(2016)提出的随机算法来简化运算。PCA结果使用ggplot2 R语言包进行绘图展示(Villanueva et al, 2019)。
1.5.2 遗传组分分析首先使用PLINK软件(Purcell et al, 2007)进行群体结构分析(Tang, 2010),Maxiter及threshold参数均设置为10, 000。计算祖先个体数量为2、3、4三种情况下的结果,结果使用R语言中的barplot函数进行绘制。
1.5.3 遗传分化分析利用GenAIEx 6.5软件计算遗传分化指数(Fst) (Chang et al, 2015)、基因差异分化系数(Gst) (Wright, 1965)和遗传距离(Dest) (Nei, 1973)值评估群体间的遗传分化,其中,每个群体的SNPs损失率设置为小于25%。
2 结果 2.1 SNP位点筛选本研究对养殖群体来源的86尾花鲈的DNA样本进行ddRAD文库构建,经测序共获得了raw data数据83 G。经过初步数据过滤,3个个体因数据量过少被剔除。BWA基因组比对的平均mapping ratio为90.32%,个体平均基因组覆盖度为1.1%,个体平均测序深度为33 X。共获得83尾个体的23, 258个SNP位点用于后续的遗传结构分析。
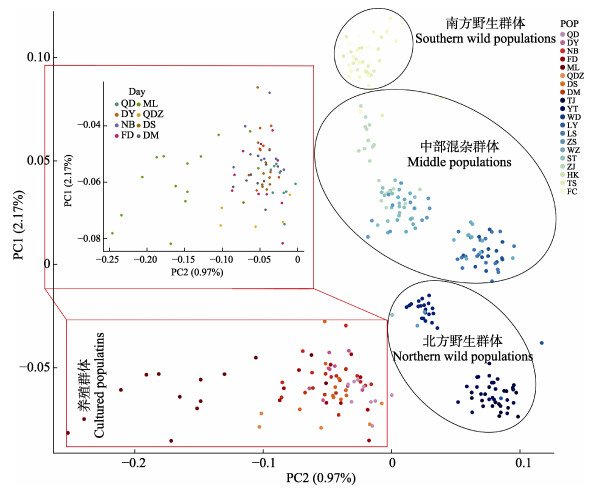
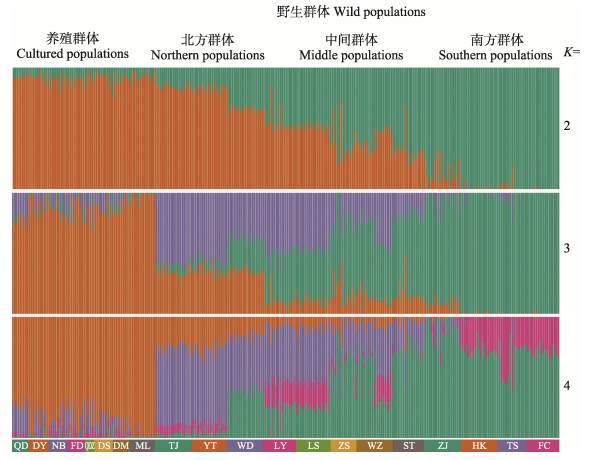
2.2 花鲈养殖与野生群体的遗传结构分析对本研究SNP分型成功的养殖群体来源的83尾花鲈个体和野生群体来源的219尾个体(Zhao et al, 2017)进行PCA分析和遗传组分分析(桥东镇养殖群体去除5个异常个体),结果见图 2和图 3。Zhao等(2017)对野生群体的主成分分析结果表明,渤海湾和黄海北部的3个群体(天津、烟台和文登)及北部湾的3个群体(海康港、铁山港和防城港)形成2个不同的分支,将其分别定义为北方群体和南方群体,剩余群体(连云港、吕四、舟山、温州、汕头和湛江)形成另一个分支,定义为中部混杂群体。本研究PCA结果显示,山东、浙江、福建和广东地区的8个养殖群体均与野生花鲈群体间存在遗传差异,而从第1主成分来看,8个养殖群体与天津、烟台和文登的野生群体间遗传差异较小,表明其遗传关系最为接近(图 2)。

|
图 2 PCA分析花鲈养殖群体与野生群体的遗传结构 Fig.2 Principal component analysis of genetic structure of cultured and wild spotted sea bass populations 红色框(上: 放大图; 下: 原图)中为养殖群体(QD:青岛;DY:东营;NB:宁波;FD:福鼎;ML:梅岭镇;QDZ:桥东镇;DS:东山县;DM:斗门);黑色椭圆中为野生群体:北方种群(TJ:天津;YT:烟台;WD:文登);中部种群(LYG:连云港;LS:吕四;ZS:舟山;WZ:温州;ST:汕头;ZJ:湛江);南方种群(HK:海康港;TS:铁山港;FC:防城港) The red box (up: enlarged image; down: original image) in the figure shows the cultured populations (QD: Qingdao; DY: Dongying; NB: Ningbo; FD: Fuding; ML: Meiling; QDZ: Qiaodong; DS: Dongshan; DM: Doumen); The wild populations are shown in the black ellipse: Northern populations (TJ: TianJin; YT: Yantai; and WD: Wendeng); Central populations (LYG: Lianyungang; LS: Lüsi; ZS: Zhoushan; WZ: Wenzhou; ST: Shantou; ZJ: Zhanjiang); Southern populations (HK: Haikanggang; TS: Tieshangang; FC: Fangchenggang) |

|
图 3 花鲈养殖群体与野生群体的遗传组分分析 Fig.3 Genetic ancestry analysis of wild and cultured spotted sea bass populations |
遗传组分分析结果显示,K值为2时,8个养殖群体与天津、烟台和文登的野生群体间的遗传差异较小,进一步验证了主成分分析的结果。K值设置为3和4时,群体间遗传差异虽更加明显,但出现了不同程度的融合现象。最佳聚类K值为2(图 3)。
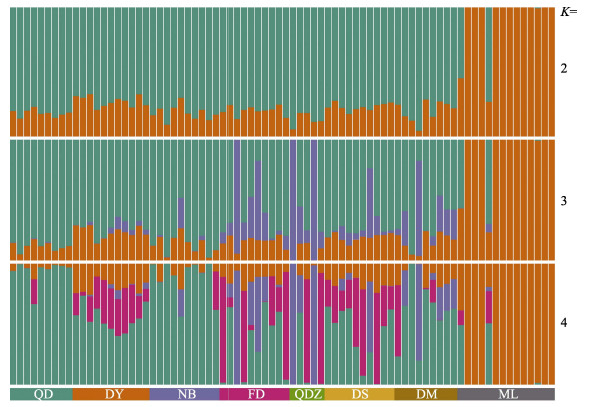
2.3 花鲈养殖群体间的遗传结构分析对8个养殖花鲈群体进行遗传结构分析,结果见图 2、图 4及表 2。PCA分析结果显示,除福建省漳州市梅岭镇养殖群体外,其他7个养殖群体(青岛、东营、宁波、福鼎、福建省漳州市桥东镇、福建省漳州市东山县和斗门)的样本聚集在一起,只有梅岭镇与其他养殖群体的遗传差异相对较大(图 2)。遗传组分分析结果表明,K值为2时,聚类效果较好,梅岭镇养殖群体与其他养殖群体间具有较大的遗传差异。与上述PCA分析结果一致(图 4)。

|
图 4 花鲈8个养殖群体的遗传组分分析 Fig.4 Genetic ancestry analysis of eight cultured spotted sea bass populations |
|
|
表 2 花鲈养殖群体的Fst、Gst和Dest值(对角线以下)的矩阵分析以及对应P值(对角线以上) Tab.2 Pairwise population matrix of Fst, Gst, and Dest values (below diagonal) and corresponding P values (above diagonal) for cultured spotted sea bass populations |
随机选取8191个高质量的SNPs用于养殖群体的遗传分化分析,群体间的遗传分化用3个值(Fst、Gst、和Dest)来估测(表 2)。如表 2所示,群体间的Fst范围为0.025~0.051,Gst范围为–0.003~0.040,Dest范围为0~ 0.004。部分花鲈群体间出现了显著的遗传差异。ML、QDZ和其他群体间Fst值均 < 0.05,群体间的遗传差异是显著的。综上所述,虽然8个花鲈养殖群体间遗传差异较小,但其内部也出现了群体分化,其中以福建梅岭镇地区的养殖花鲈群体与其他群体的遗传距离最远。
3 讨论关于花鲈种群遗传的研究较多,但方法不尽相同,以往的研究主要基于有限数量的微卫星标记(Jiang et al, 2010; Zhang et al, 2016)、线粒体DNA序列(Wang et al, 2017)及SNPs标记的研究(Wang et al, 2016; Zhao et al, 2017)。此外,Zhao等(2017)用全基因组SNPs对中国沿海自然分布的野生花鲈群体进行了较为精确的群体遗传结构分析,证实了黄、渤海和北部湾的野生群体间具有较高的遗传差异,并定义了北方、南方和中间混合群体。本研究利用ddRAD技术,基于全基因组发掘的SNP标记对8个不同地理来源的花鲈养殖群体的遗传结构进行分析,以明确我国主要养殖花鲈的种质来源。PCA分析结果表明,山东、浙江、福建和广东地区的8个养殖群体均与野生花鲈群体间存在较显著的遗传分化。而从第1主成分来看,8个养殖群体与天津、烟台和文登的渤海湾和黄海北部野生群体间遗传差异较小,表明其遗传关系较近,该结果与花鲈养殖过程中亲鱼与种苗流动的整体情况相符。花鲈是我国水产养殖的优良品种,由于其广温、广盐性及较强的抗逆能力,分布较为广泛。与其他地理群体相比,高纬度的渤海湾和黄海北部花鲈群体生长性状较好,因此,大量花鲈养殖苗种由黄、渤海来源的亲鱼经人工繁育获得,然后被运送到中国其他地区进行网箱和河口地区池塘养殖。此外,对本研究的8个花鲈养殖群体进行了单独的遗传结构分析。结果表明,养殖群体间遗传差异较小,但也出现一定程度的遗传分化,其中,漳州地区的桥东镇和梅岭镇的2个养殖群体与其他养殖群体间Fst值出现显著差异。本研究结果也与当地花鲈养殖实际情况相符,桥东镇和梅岭镇所属的漳州市是一个特殊的花鲈养殖地区,花鲈亲鱼的来源较广,包括当地养殖亲鱼群体以及北方苗种培育后的亲鱼群体,同时,漳州得天独厚的天然优势使其成为我国花鲈商品鱼和苗种流通的一个中转站,导致其花鲈群体来源背景更为复杂。
Zhao等(2017)对我国沿海花鲈野生群体研究结果表明,12个群体间的遗传分化程度较低,Fst平均为0.030(范围为0.015~0.057),最低的差异出现在渤海湾群体间,而最高的差异出现在铁山港和烟台的野生群体。与以上研究结果相似,本研究结果显示,各养殖群体间遗传分化程度也较低,Fst平均为0.034(范围为0.025~0.051),最低的差异出现在东营与东山、福鼎群体间,而最高的差异出现在梅岭镇和桥东镇的养殖群体。同样,较低的遗传分化已经在海洋物种,如瓦氏雅罗鱼(Leuciscus waleckii)(Xu et al, 2016)、欧洲鲈鱼(Dicentrarchus labrax)(Tine et al, 2014)和潮间带蜗牛(Chlorostoma funebralis)(Gleason et al, 2016)的研究中报道。在海洋物种中,高群体扩散可以促进基因流动和遗传混合,这与大的空间规模下轻微的遗传差异相关。低遗传分化表明,中国花鲈养殖群体存在大量的基因流动和遗传混合。本研究对中国花鲈主要养殖地区的种群结构进行鉴定区分,丰富了鱼类群体遗传多样性的研究方法,可为后续花鲈品质资源的保护、育种工作提供依据。
CATCHEN J M, AMORES A, HOHENLOHE P, et al. Stacks: Building and genotyping loci de novo from short-read sequences. G3 (Bethesda), 2011, 1(3): 171-182 DOI:10.1534/g3.111.000240 |
CATCHEN J, HOHENLOHE P A, BASSHAM S, et al. Stacks: An analysis tool set for population genomics. Molecular Ecology, 2013, 22(11): 3124-3140 DOI:10.1111/mec.12354 |
CHANG C C, CHOW C C, TELLIER L C, et al. Second-generation plink: Rising to the challenge of larger and richer datasets. Gigascience, 2015, 4(1): 7 DOI:10.1186/s13742-015-0047-8 |
FUTUYMA D J, MAYER G C. Non-allopatric speciation in animals. Systematic Biology, 1980, 29(3): 254-271 DOI:10.1093/sysbio/29.3.254 |
GALINSKY K J, BHATIA G, LOH P R, et al. Fast principal-component analysis reveals convergent evolution of Adh1B in Europe and East Asia. American Journal of Human Genetics, 2016, 98(3): 456-472 DOI:10.1016/j.ajhg.2015.12.022 |
GLEASON L U, BURTON R S. Genomic evidence for ecological divergence against a background of population homogeneity in the marine snail Chlorostoma funebralis. Molecular Ecology, 2016, 25(15): 3557-3573 DOI:10.1111/mec.13703 |
GONG J, CHEN B H, LI B J, et al. Genetic analysis of whole mitochondrial genome of Lateolabrax maculatus (Perciformes: Moronidae) indicates the presence of two populations along the Chinese coast. Zoologia, 2020, 37: e49046 |
HU Z M, GAO T X, HAN Z Q, et al. Studies on genetic differentiation of the spotted sea bass (Lateolabrax maculatus) and Japanese sea (Lateolabrax japonicus). Periodical of Ocean University of China (Natural Science), 2007, 37(3): 413-418 [胡自民, 高天翔, 韩志强, 等. 花鲈和鲈鱼群体的遗传分化研究. 中国海洋大学学报(自然科学版), 2007, 37(3): 413-418] |
JIANG X B, YANG G, LIAO M, et al. Microsatellite DNA polymorphism of Japanese sea bass (Laterolabrax japonicus) inhabiting Chinese and Japanese coasts. Journal of Applied Ichthyology, 2010, 24(2): 180-186 |
JIANG X, YANG G P, WEI Q W, et al. Analysis of the genetic structure of spotted sea bass (Lateolabrax maculatus) inhabiting the Chinese coast. Periodical of Ocean University of China (Natural Science), 2009, 39(2): 271-274 [江鑫, 杨官品, 危起伟, 等. 中国沿海花鲈群体遗传结构分析. 中国海洋大学学报(自然科学版), 2009, 39(2): 271-274] |
KIM Y U, MYOUNG J G, KIM Y S, et al. The marine fishes of Korea. Hanguel, Pusan, 2001, 222 |
LI H, DURBIN R. Fast and accurate long-read alignment with Burrows-Wheeler transform. Bioinformatics, 2010, 26(5): 589-595 DOI:10.1093/bioinformatics/btp698 |
LI Y Y, LIU Y G, LIU L X, et al. Germplasm identification techniques based on fish molecular systematics. Genomics and Applied Biology, 2017, 36(1): 227-232 [李瑶瑶, 刘云国, 刘凌霄, 等. 基于分子系统学的鱼类种质鉴定技术. 基因组学与应用生物学, 2017, 36(1): 227-232] |
LIU J X, GAO T X, YOKOGAWA K, et al. Differential population structuring and demographic history of two closely related fish species, Japanese sea bass (Lateolabrax japonicus) and spotted sea bass (Lateolabrax maculatus) in northwestern Pacific. Molecular Phylogenetics and Evolution, 2006, 39(3): 799-811 DOI:10.1016/j.ympev.2006.01.009 |
LOU D, GAO T X, ZHANG X M, et al. The advances on germplasm resources study of Lateolabrax. Journal of Zhejiang Ocean University (Natural Science), 2000, 19(2): 162-167 [楼东, 高天翔, 张秀梅, 等. 花鲈种质资源的研究进展. 浙江海洋学院学报(自然科学版), 2000, 19(2): 162-167 DOI:10.3969/j.issn.1008-830X.2000.02.014] |
NEI M. Analysis of gene diversity in subdivided populations. Proceedings of the National Academy of Sciences of the United States of America, 1973, 70(12): 3321-3323 DOI:10.1073/pnas.70.12.3321 |
PETERSON B K, WEBER J N, KAY E H, et al. Double digest Radseq: An inexpensive method for de novo SNP discovery and genotyping in model and non-model species. PLoS One, 2012, 7: e371355 |
PURCELL S, NEALE B, TODD-BROWN K, et al. Plink: A tool set for whole-genome association and population-based linkage analyses. American Journal of Human Genetics, 2007, 81(3): 559-575 DOI:10.1086/519795 |
SHAN B B, SONG N, HAN Z Q, et al. Complete mitochondrial genomes of three sea basses Lateolabrax (Perciformes, Lateolabracidae) species: Genome description and phylogenetic considerations. Biochemical Systematics and Ecology, 2016, 67: 44-52 DOI:10.1016/j.bse.2016.04.007 |
SUN J C, LI X, LU K L, et al. Effects of dietary vitamin C on the immune, antioxidant capacity, and stress tolerance of spotted seabass (Lateolabrax maculatus) after acute cooling. Progress in Fishery Sciences, 2021, 42(4): 126-133 [孙敬诚, 李潇, 鲁康乐, 等. 饲料维生素C对急性降温后花鲈免疫、抗氧化及抗应激的影响. 渔业科学进展, 2021, 42(4): 126-133] |
TANG H. Estimation of individual admixture: Analytical and study design considerations. Genetic Epidemiology, 2010, 28(4): 289-301 |
TINE M, KUHL H, GAGNAIRE P A, et al. European sea bass genome and its variation provide insights into adaptation to euryhalinity and speciation. Nature Communications, 2014, 5: 5770 DOI:10.1038/ncomms6770 |
VILLANUEVA R A M, CHEN Z J. Ggplot2: Elegant graphics for data analysis. Measurement: Interdisciplinary Research and Perspectives, 2019, 17(3): 160-167 DOI:10.1080/15366367.2019.1565254 |
WANG J, XUE D X, ZHANG B D, et al. Genome-wide SNP discovery, genotyping and their preliminary applications for population genetic inference in spotted sea bass (Lateolabrax maculatus). PLoS One, 2016, 11(6): e0157809 DOI:10.1371/journal.pone.0157809 |
WANG W, MA C, CHEN W, et al. Population genetic diversity of Chinese sea bass (Lateolabrax maculatus) from southeast coastal regions of China based on mitochondrial COI gene sequences. Biochemical Systematics and Ecology, 2017, 71: 114-120 DOI:10.1016/j.bse.2017.01.002 |
WEN H S, ZHANG M Z, LI J F, et al. Research progress of aquaculture industry and its seed engineering in spotted sea bass (Lateolabrax maculatus) of China. Fishery Information and Strategy, 2016, 31(2): 105-111 [温海深, 张美昭, 李吉方, 等. 我国花鲈养殖产业现状与种子工程研究进展. 渔业信息与战略, 2016, 31(2): 105-111] |
WRIGHT S. The interpretation of population structure by F-statistics with special regard to systems of mating. Evolution, 1965, 19(3): 395-420 DOI:10.1111/j.1558-5646.1965.tb01731.x |
XU J, LI J T, JIANG Y, et al. Genomic basis of adaptive evolution: The survival of Amur ide (Leuciscus waleckii) in an extremely alkaline environment. Molecular Biology and Evolution, 2016, 34(1): 145-159 |
ZHANG H R, NIU S F, WU R X, et al. Development and characterization of 26 polymorphic microsatellite markers in Lateolabrax maculatus and cross-species amplification for the phylogenetically related taxa. Biochemical Systematics and Ecology, 2016, 66: 326-330 DOI:10.1016/j.bse.2016.05.008 |
ZHAO Y F, PENG W Z, GUO H Y, et al. Population genomics reveals genetic divergence and adaptive differentiation of Chinese sea bass (Lateolabrax maculatus). Marine Biotechnology, 2017, 20(1): 45-59 |
ZHENG X, LEVINE D, SHEN J, et al. A high-performance computing toolset for relatedness and principal component analysis of SNP data. Bioinformatics, 2012, 28(24): 3326-3328 DOI:10.1093/bioinformatics/bts606 |


