2. 青岛海洋科学与技术试点国家实验室海洋地质过程与环境功能实验室 山东 青岛 266237;
3. 中国海洋大学海洋 化学理论与工程技术教育部重点实验室 山东 青岛 266100
2. Laboratory for Marine Geology, Pilot National Laboratory for Marine Science and Technology (Qingdao), Qingdao, Shandong 266237, China;
3. Key Laboratory of Marine Chemistry Theory and Technology, Ministry of Education, Ocean University of China, Qingdao, Shandong 266100, China
氮(N)和磷(P)是生物生命活动所必须的元素,陆地和水生生态系统中的初级生产均依赖于这些营养元素。近年来,随着食物和能源需求及其产量的增加,农业用地的扩张、污水的排放以及水产养殖等密集的人类活动使N和P的浓度、负荷以及向海输送的通量大大增加(Galloway et al, 2008; Bouwman et al, 2009)。人类活动产生过量的N和P进入水体会造成水体富营养化现象,改变水环境理化性质,并对水生生态系统的结构和功能产生了诸多不利的影响(Wang et al, 2021a; Diaz et al, 2008; Turner et al, 1998; Rousseau et al, 2000; Bouwman et al, 2013b; 夏斌等, 2009; 过锋等, 2012)。
富营养化现象在我国主要河流流域均较为严峻。以长江为例,1970—2010年,长江总氮(TN)的净输出量由337 Gg/yr增加到5900 Gg/yr(1 G=109);总磷(TP)从58 Gg/yr增长到381 Gg/yr,二者较1970年相比分别增加17.51和6.57倍(Liu et al, 2018)。长江每年携带大量的营养物质输送到河口,对长江口和邻近的东海生态系统产生了长期的生态效应。长江口地区报道的赤潮事件由20世纪80年代的29起增加到21世纪初的195起(国家海洋局, 2002—2009),从而导致了一系列河口环境问题的出现(Li et al, 2002; Wang, 2009)。长江N、P输送通量的增加与流域内养殖规模的扩大息息相关。我国是世界第一水产养殖大国,为满足日益增长的蛋白质供给需求,养殖规模不断扩大。但粗放式的管理模式以及高密度的养殖往往伴着许多环境问题出现,特别是养殖废水中高浓度的化学耗氧量(COD)和N、P等污染物排放,加剧了水体富营养化程度,继而由河到海引起了藻类大量繁殖和一系列次生环境危害,产生了诸如食物网结构的变化、生物多样性降低、缺氧和底栖生物死亡等系列环境问题(过锋等, 2012; 夏斌等, 2009、2013; 徐东会等, 2017; 白怀宇等, 2018; 郭永坚等, 2015; Bouwman et al, 2013b; Wang et al, 2019b)。目前,我淡水养殖面积超过500万hm2,并以池塘、湖泊和水库为主(农业农村部渔业渔政管理局等, 2019、2020; 刘国锋等, 2018)。规模化的水产养殖释放的N、P已经成为区域N、P负荷的重要来源,如太湖(王艳艳等, 2008;彭凌云等, 2020)和阳澄湖(穆玉林等, 2018; 辛玉婷, 2007),其养殖活动对湖泊水体N、P的贡献和对水环境质量的影响不容轻视。
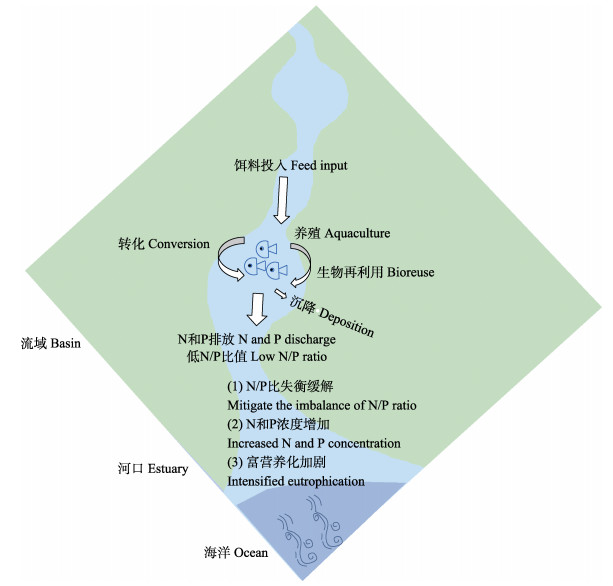
长江是我国最重要的大河,其生态环境面临巨大压力。为了恢复长江经济带的生态环境,2019年《长江保护修复攻坚战行动计划》出台,2020年长江流域重点水域“十年禁渔”活动全面启动。“十年禁渔”减少了捕捞产量,必然会催生长江流域养殖业的发展,以保证渔业产品的有序供应。据统计,2019年中国养殖总产量达到5079万t,这个产量还在增长中(农业农村部渔业渔政管理局等, 2019、2020)。可见,养殖产业的发展将会进一步提高水体N和P的浓度水平,并对流域—河口环境产生不利的影响,如富营养化和营养盐结构失衡(图 1)。

|
图 1 养殖等人类活动对河流N、P输送的影响 Fig.1 Effect of freshwater aquaculture on the riverine nitrogen and phosphorus transports |
目前,对淡水养殖的负荷及其生态效应方面的了解极为匮乏,缺少必要的方法和评估数据,部分基于现场观测的研究仅局限在湖泊等有限的区域,无法有效地制定大河流域N、P污染防治的科学策略,以及合理地规划养殖产业。因此,亟需科学评估水体养殖N、P污染,以期为方法学研究与水环境治理工作提供有益的尝试。本研究通过集成式环境评估模式—营养盐模型(IMAGE-GNM),计算了2003—2018年长江流经主要省份淡水养殖引起的TN和TP年排放量,通过对比时间与空间的变化,量化了淡水养殖污染排放变化对河流物质输送及河口环境的影响。相关工作可为长江流域科学养殖规划和环境管理与保护提供参考。
1 材料与方法 1.1 研究区域概况长江全长约6300 km,流域面积达180万km2。横跨中国东部、中部和西部3大经济区,干流流经西藏、青海、云南、四川、重庆、湖南、湖北、安徽、江西、上海等共计11个省、市、自治区。长江经济带面积约205万km2,占全国的21%,人口和经济总量均超过全国的40%。长江流域水域面积广,淡水养殖极为发达,流域内的江苏、湖北、江西、安徽等都是我国淡水养殖的大省(农业农村部渔业渔政管理局等, 2019、2020)。
近些年,由于受到过渡捕捞等人类活动的强力干扰,长江渔业资源呈现退化乃至枯竭的趋势。2019年1月,农业农村部、财政部、人力资源社会保障部联合印发《长江流域重点水域禁捕和建立补偿制度实施方案》,计划在长江干流和重要支流等重点水域逐步实行合理期限内生产性禁捕的禁渔期制度;长江流域禁渔自2021年1月1日起实行,暂定为10年的常年性禁捕,以期逐步恢复长江流域大生态系统。
1.2 研究方法 1.2.1 IMAGE-GNM模型IMAGE-GNM模型是一种空间分布模型(0.5°×0.5°分辨率),将IMAGE综合评估模型与全球水文模型PCR-GLOBWB相结合,用来评估全球环境与营养盐的模型(Bouwman et al, 2006、2017; Van Beek et al, 2011; Beusen et al, 2015、2016)。该模式为网格化数值模式,通过与水文模式的集成实现了营养盐来源和输送通量的准确评估。
IMAGE-GNM模型包括:(1)从农业和自然土地系统,通过径流到地表水以及通过浅层地下水和深层地下水、河岸带等地区浸出,最终流到地表水的N和P;(2)污水排放和水产养殖排放的N和P;(3)来自河滩植被的外来有机物质的营养盐输入;(4)用营养盐螺旋理论(nutrient spiraling method) (Wollheim et al, 2008; Newbold et al, 1981)计算水体中N、P滞留量。关于输入和辅助数据的更多细节可以参考Beusen等(2015、2016)的方法(Stehfest et al, 2014)。IMAGE-GNM水产养殖收支模型(0.5°×0.5°分辨率)是基于联合国世界粮农组织统计数据(FISHSTAT)来计算养殖系统中的营养盐流动(Food and Agriculture Organization of the United Nations, 1950—2010; Wang et al, 2019b),最后根据水文模型中各网格水流方向提取出进入河流的N和P负荷。IMAGE-GNM模型已经在长江N、P营养盐来源、滞留和输送研究中得到了实际应用,其对我国淡水和海水养殖的N、P释放的估算也真实地反映了养殖污染的现状(Liu et al, 2018; Wang et al, 2019b),相关N、P通量的估算与实测结果具有较高的一致性,这也从一个侧面说明使用IMAGE-GNM模型估算养殖N、P负荷具有一定的可信度。
1.2.2 营养盐收支模型计算鉴于我国淡水养殖鱼类占绝对优势(唐启升等, 2016),因此,在计算淡水养殖N、P负荷时主要考虑鱼类。根据农业农村部的统计,我国养殖业饲料消耗量在2019年约为3.5亿t,其中,商品配合饲料2.1亿t,占比为60%,其余40%为养殖者自行配制(农业农村部, 2020)。
使用IMAGE-GNM模型,基于鱼类在生产过程中的营养盐收支理念估算淡水养殖对水体N、P负荷的贡献量;该模型包含了饲料中营养盐的输入、生产中的转化、鱼类中的营养成分、以排泄物和溶解营养盐形式的流出以及池塘系统的循环(Bouwman et al, 2011、2013a; Wang et al, 2019b)。其中,配合饲料的N输入计算如下:
| $ \begin{gathered} N_{\text {in-com }}=\operatorname{Prod}_{\text {Fish }} \times \mathrm{WG}_{\text {Frac }} \times \text { Frac}_{\text {in-comp }} \times \\ \mathrm{FCR}_{\text {in-com }} \times N_{\text {Frac-in-comp }} \end{gathered} $ | (1) |
| $ \begin{gathered} P_{\text {in-com }}=\text { Prod}_{\text {Fish }} \times \mathrm{WG}_{\text {Frac }} \times \text { Frac}_{\text {in-comp }} \times \\ \text { FCR}_{\text {in-com }} \times P_{\text {Frac-in-comp }} \end{gathered} $ | (2) |
式中,Nin-com和Pin-com分别为通过配合饲料进入系统的N和P量(t);ProdFish为鱼类的产量(t)(农业农村部渔业渔政管理局等, 2019—2020);WGFrac为产量中鱼实际增重的部分,为了将生产数据转换为增重,所有鱼种使用了世界粮农组织生产数据的95%的转换系数(即初始重量为产量的5%) (Bouwman et al, 2013a);Fracin-comp为投喂配合饲料的比例(60%;农业农村部, 2020);FCRin-com为生产1 kg鱼所用的配合饲料量,本研究采用的FCRin-com为2.0 g/g (Bouwman et al, 2013a);NFrac-in-comp和PFrac-in-comp为配合饲料中的N和P含量。其中,N为0.05 g/g,P为0.01 g/g (Bouwman et al, 2013a; Wang et al, 2019b)。
非配合饲料的N输入计算如下:
| $ N_\rm{in-noncom} = Prod_{Fish} × WG_{Frac} × Frac_{in-noncomp} × $ |
| $ {\rm FCR _{in-noncom}} × N_\rm{Frac-in-noncomp} $ | (3) |
| $ P_\rm{in-noncom}= Prod_{Fish} × WG_{Frac} × Fra_{in-noncom}× $ |
| $ {\rm FCR_{in-noncom}} × P_\rm{Frac-in-noncom} $ | (4) |
式中,Nin-noncom和Pin-noncom分别为通过非配合饲料进入系统的N和P量(t);Fracin-comp为投喂非配合饲料的比例(40%; 农业农村部, 2020);FCRin-noncom为生产1 kg鱼所用的非配合饲料量。本研究采用FCRin-noncom为6.0 g/g (Bouwman et al, 2013a; Wang et al, 2019b);NFrac-in-noncom和PFrac-in-noncom分别为非配合中饲料的N和P含量,其中,N为0.03 g/g,P为0.004 g/g(Bouwman et al, 2013a; Wang et al, 2019b)。
| $ N_{\text {in }}=N_{\text {in-com }}+N_{\text {in-noncom }} $ | (5) |
| $ P_{\text {in }}=P_{\text {in-com }}+P_{\text {in-noncom }} $ | (6) |
式中,Nin和Pin分别为流入系统的TN和TP量(t)。
鱼类生物量中留存N和P的量计算如下:
| $ N_{\text {Fish }}=\operatorname{Prod}_{\text {Fish }} \times \mathrm{WG}_{\text {Frac }} \times N_{\text {Frac-Fish }} $ | (7) |
| $ P_{\text {Fish }}=\operatorname{Prod}_{\text {Fish }} \times \mathrm{WG}_{\text {Frac }} \times P_{\text {Frac-Fish }} $ | (8) |
式中,NFish和PFish分别为增加的重量中N和P的重量(t);NFrac-Fish和NFrac-Fish分别为鱼类生物量中N和P含量,其中,N的含量为0.024 g/g,P的含量为0.007 g/g (Bouwman et al, 2013a; Wang et al, 2019b)。
颗粒氮和磷与溶解氮和磷的释放量计算如下:
| $ \begin{aligned} \mathrm{PN}= & \left(1-N_{\text {ADC-comp }}\right) \times N_{\text {in-com }}+ \\ & \left(1-N_{\text {ADC-noncomp }}\right) \times N_{\text {in-noncom }} \end{aligned} $ | (9) |
| $ \begin{aligned} \mathrm{PP}= & \left(1-P_{\text {ADC-comp }}\right) \times P_{\text {in-com }}+ \\ & \left(1-P_{\text {ADC-noncomp }}\right) \times P_{\text {in-noncom }} \end{aligned} $ | (10) |
| $ \mathrm{DN}=N_{\text {in }}-N_{\text {Fish }}-\mathrm{PN} $ | (11) |
| $ \mathrm{DP}=P_{\text {in }}-P_{\text {Fish }}-\mathrm{PP} $ | (12) |
式中,PN和PP分别为颗粒态氮和磷的释放量(t);DN和DP分别为溶解态氮和磷的释放量(t);NADC-comp和PADC-comp分别为配合饲料的N和P表观消化率,其中,N为0.9 g/g,P为0.6 g/g(Bouwman et al, 2013a);NADC-noncomp和PADC-noncomp分别为非配合饲料的N和P表观消化率,其中,N为0.7 g/g,P为0.45 g/g (Bouwman et al, 2013a)。
本研究将长江流域分为上游(宜昌以上)、中游(宜昌至湖口)以及下游(湖口以下)3个部分,所有数据使用TN和TP(质量浓度单位)表示。2018年各省人口数来自中国统计年鉴(国家统计局, 2019);2018年各省淡水养殖鱼类产量来自中国渔业统计年鉴(农业农村部渔业渔政管理局, 2019、2020)。为使估算结果与实际观测之间存在较好的一致性,方法中各参数的赋值是基于我国最新的统计结果,并参考了联合国世界粮农组织的数据,这在大河流域养殖污染估算中具有合理性。为验证估算的可行性,本研究的估算结果还与已有的研究(刘长发等, 2002; 高立方等, 2021)结果进行了对比分析。
2 结果与讨论 2.1 长江流域主要省份淡水养殖产生的N与P分布2003年与2018年长江流经主要省份淡水养殖产生的N、P负荷见表 1。从表 1可以看出,根据IMAGE-GNM的计算结果,2003—2018年长江流经主要省份淡水养殖引起的TN和TP年释放量分别为(468.41±179.22)和(52.02±24.08) Gg/yr。由表 1计算可知,淡水养殖引起的N和P污染具有相一致的空间分布。长江流域上、中和下游主要省份淡水养殖引起的TN年排放量平均值分别为(49.44±18.66)、(312.17±126.78)和(106.80±33.77) Gg/yr,分别占长江流域TN年排放量的10.44%、66.38%和23.18%。上游、中游和下游主要省份淡水养殖引起的TP年排放量平均值分别为(4.52±2.06)、(46.42±28.86)和(12.58±4.66) Gg/yr,分别占长江流域TP年排放量的8.60%、88.45%和24.80%。淡水养殖引起的N、P营养盐排放量最大的省为湖北省,其TN和TP的年排放量分别为(140±58.6)和(16.3±8.68) Gg/yr,分别占流域淡水养殖N和P污染排放量的(29.96±1.71)%和(31.27±4.11)%,其次为江西省和湖南省。由湖北省、湖南省和江西省组成的中游干流区占淡水养殖N和P总排放量的(64.63±2.89)%和(65.23±4.88)%,年均排放量分别为302.72和33.93 Gg/yr。此外,95%以上的淡水养殖引起的N和P排放量由干流流经省份(包括四川、重庆、湖北、湖南、江西、安徽和江苏)组成,这些省份大多人口密集,养殖业比较发达,养殖产量也比较高(表 1)。本研究的结果与早前的研究结果相近(高立方等, 2021),即湖北、湖南、江西和江苏省淡水养殖的TN和TP排放量较大,4个省的贡献量达到70%左右。
|
|
表 1 2003年与2018年长江流经主要省份淡水养殖产生的N、P负荷和人口 Tab.1 Spatial distributions of nitrogen and phosphorus in freshwater aquaculture and population around the Changjiang River basin in 2003 and 2018 |
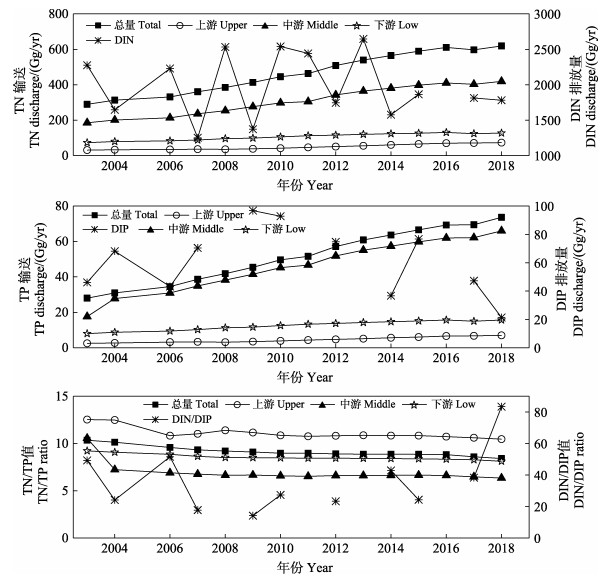
从图 2可以看出,长江流经主要省份淡水养殖的TN排放量增长了213.96%,由2003年的289.19 Gg/yr增长至2018年的618.76 Gg/yr。上、中、下游整体均呈稳定增加的趋势。其中,中游地区的增长最为显著,由2003年的185.38 Gg/yr增加至2018年的418.70 Gg/yr。但2016—2018年间,TN排放量的增长出现停滞。流域淡水养殖的TP污染负荷同样表现为增长状态,排放量由2003年的27.94 Gg/yr增加至2018年的73.55 Gg/yr;其中,中游地区的释放量增长也最为显著,由2003年的17.57 Gg/yr增加至2018年的65.94 Gg/yr,是流域淡水养殖TP污染的主要来源。此外,TP的增长幅度略高于TN,为263.24%。尽管2016年后淡水养殖排放的TP增长速度同样放缓,但不同于TN排放量的稳定维持,TP排放负荷仍保持增长状态,流域淡水养殖排放的N/P值(质量比)介于6.35~12.53之间,并随着淡水养殖排放的TP增长量相对TN增加,其N/P在全流域整体表现为缓慢下降的趋势。已有研究表明,长江经济带1991—2019年淡水养殖TN与TP的排放量均呈增长的趋势。2017年以来,TN排放量有所下降,TP排放量变化趋势与TN基本一致;2019年淡水养殖排放的N/P为5.39(高立方等, 2021),与本研究模拟的结果相一致。刘长发等(2002)研究发现,水产养殖过程中生产1 kg鱼类生物量,TN和TP可产生30 g和7 g。根据2018年长江流域各省份淡水养殖鱼类产量,生产2150万t的鱼类TN和TP约产生645和150.5 Gg,这一粗略的估算也与本研究的结果接近。上述对比分析表明,本研究中基于IMAGE-GNM模型所获得的结果是可靠的。

|
图 2 2003—2018年长江流域淡水养殖TN、TP排放与流域DIN、DIP排放变化 Fig.2 The variations in TN and TP emissions of freshwater aquaculture and DIN and DIP emissions from 2003 to 2018 in Changjiang River basin 图 2中长江流域DIN和DIP的年排放通量数据来自Wang等(2021b)。 The annual fluxes of DIN and DIP in the Changjiang River were from Wang et al (2021b). |
近几十年长江流域N、P的输出和营养盐结构变化较大(Liu et al, 2018)。1960—2015年长江流域溶解无机氮(DIN)的输出呈稳定增长趋势,但近10年波动较大,增长速度不明显(图 2)。2003—2018年间,长江流域DIN的年排放量平均值为1980 Gg/yr,其中,淡水养殖排放的TN约占DIN的23.64%。1960—2015年长江流域溶解无机磷(DIP)的输出与DIN的变化相似,但是,近5年DIP输送通量有降低的趋势。2003—2018年,长江流域DIP年输送量的平均值为61 Gg/yr,其中,淡水养殖的TP排放约占84.83%。长江流域DIN/DIP值平均值为36 (质量比),可见,流域各省份养殖活动对于长江营养盐浓度、结构和通量均有较大的影响,需要进一步的关注。
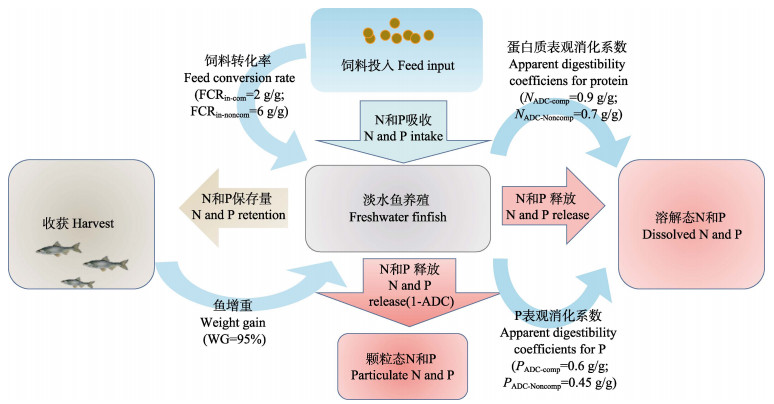
2.3 淡水养殖中的N、P循环与输出从表 1可以看出,长江流经主要省份淡水养殖鱼类产量为2150万t。图 3为淡水鱼类养殖过程中N、P营养盐的输入、在生产中的转化、鱼类中的营养成分、以排泄物和溶解营养盐形式的流出以及N、P池塘系统的循环过程。

|
图 3 IMAGE-GNM模拟淡水鱼类养殖中N、P过程 Fig.3 IMAGE-GNM for freshwater finfish of nitrogen and phosphorus processes |
将数据带入公式(1)~(12),计算可得肥料进入系统的氮量(Nin)为269.48万t,磷量(Pin)为44.10万t。鱼类生物量中留存的氮量(NFish)为50.1万t,磷量(PFish)为14.3万t。PN的释放量为56.35万t,PP的释放量为20.58万t。DN的释放量为163.08万t,DP的释放量为9.23万t。本研究结果与Bouwman等(2013)和Wang等(2019b)研究的N、P的输出比例较为接近。此外,根据模式还可以得知,进入淡水养殖的饲料约有60.52%的N以溶解态的形式被释放,20.91%的N会转化为颗粒态形式,18.57%的N会被生物完全利用。P约有20.93%以溶解态的形式被释放,46.67%转化为颗粒态的形式,32.40%的P会被生物完全利用。可见,N与P生物利用率的差异应是导致水体N/P变化的主要因素,也可能是导致水体磷限制的主要因素。
2.4 不确定性分析目前,关于养殖中N、P污染的估算主要是根据实测结果的收支方法(王艳艳等, 2008; 彭凌云等, 2020),且可对比的研究案例较少;这种基于收支的方法对于观测的依赖性较高,难以扩展到大河流域;另外,基于观测的估算对于数据的观测频率、范围等依赖度较高,因此,其估算存在较大的不确定性。本研究估算是基于统计数据和数值模式,相关计算围绕主要过程,其结果也可能存在一定的不确定性。不过,IMAGE-GNM模型对长江N、P通量的估算结果与实测数据存在较好的一致性(Liu et al, 2018),也从一个侧面说明本研究对于养殖活动来源的N、P估算结果存在较高的合理性。另外,方法中各参数的赋值基于统计结果,可以减少养殖模式的不同对N、P负荷估算不确定性的影响,是当前养殖污染估算中较为可行的方法。本研究的估值与基于观测和收支的结果极为接近,这也有力地说明本研究的方法和估算结果具有较高的合理性。
由于缺少可利用的数据,本研究未能对西藏和青海2个省养殖N、P产量进行估算。不过,2个省地处高原,人口稀少,养殖业占比较低(农业农村部渔业渔政管理局等, 2019、2020)。此外,大量的数据显示,长江源区水质普遍较好(Liu et al, 2018; Huang et al, 2021),养殖等人类活动影响较低。因此,西藏和青海数据的缺失对长江流域养殖N、P污染负荷的估算影响有限。另外,本研究计算的结果以省为基础,其面积大于长江流域面积,但估算结果仍能真实代表长江流域的情况(Liu et al, 2018),在很大程度上是由于养殖活动主要围绕河流等水域展开。
本研究方法对于估算养殖N、P负荷是一种有益的尝试,可以直观地了解养殖对河流水体N、P来源及输送通量的贡献;后续将增加与实测数据的对比提高模拟的准确性。
2.5 淡水养殖对流域与河口的影响及对策建议养殖产生的N、P其生物活性和周转速率较土壤侵蚀等来源的N、P更高(Bouwman et al, 2011; Huang et al, 2020、2021),势必增强了河流—河口富营养化等生态风险。值得说明的是,养殖产生的N、P等污染物对养殖区沉积物和水环境的影响是一个长久持续的过程,不会随着养殖活动的结束而立即消失,这主要是由于埋藏在沉积物中的污染物会通过沉积物—水界面不断地释放到水环境中(王毛兰等, 2021),特别是养殖活动持续时间长的水域,其沉积物中污染物的积累量也较大。一般高密度的养殖活动都会导致水质恶化,制约养殖业的可持续发展,甚至还会对水产品产生毒害作用,造成经济和生态双重损失。因此,应重视养殖活动对大河流域水环境的影响。长江流域的TN和TP输送通量增长明显,与此同时,N/P也由13增长至35 (Liu et al, 2018)。当前,长江流域淡水养殖的N、P负荷与1900年的河流N、P的输送通量的数值相当(Liu et al, 2018)。2003—2018年的年平均TN和TP排放量占长江流域2010年TN和TP排放量的7.93%和13.65%;随着流域内各种人为干扰引起的N、P排放量的增加,淡水养殖的TN和TP排放量增长迅速。尽管淡水养殖污染并非长江流域TN和TP最为主要的来源,然而,1990年后,淡水养殖排放的TN和TP占比呈逐年增加的趋势(Liu et al, 2018; Zhao et al, 2008),特别是一些养殖较为密集的湖泊流域;如阳澄湖(仅东湖区)每年排入湖中的养殖TN和TP负荷分别为67和4.9 t/yr (辛玉婷, 2007),其养殖N、P污染物的单位面积产生量要远高于太湖,后者产生的TN和TP的排放量分别为6100和130 t/yr (彭凌云等, 2020)。值得注意的是,与其他人为污染产生的高N/P值不同,淡水养殖污染的N/P值则较低。本研究中,流域淡水养殖污染排放的N/P值介于6.35~12.53之间。刘梅等(2021)研究表明,清洁高效养殖方式尾水中N/P值为3.00,传统养殖模式为3.65。不同鱼类混养模式系统的水层中N/P值介于2.53~3.03之间(孙云飞等, 2015),这表明目前的养殖模式还需改进。长江流域2012—2016年月平均向海输送N/P值为16.20 (Wang et al, 2019a),略高于养殖污染的N/P。因此,随着淡水养殖在流域营养盐负荷中占比的增长,或对长江和河口N/P失衡的趋势产生了一定的缓解作用。不过,目前长江流域普遍存在磷限制的现象,P的增加,无疑会引起流域、河口和近岸海域生物量的显著增加,特别是潜在引起非硅藻类生物量的大量增加(Garnier et al, 2010; Glibert, 2017; Glibert et al, 2017; Wurtsbaugh et al, 2019)。对长江中下游地区33个浅水湖泊浮游植物研究发现,当TN/TP值介于12~30时,蓝藻(Cyanobacteria)的生物量随TP的增长呈指数增长趋势;当TN/TP值< 12时,蓝藻随TP的增长呈对数性增长趋势(吴世凯, 2007)。当前,长江流域中下游湖泊中较为严重的蓝藻水华或许与养殖N、P污染及其对水体中N/P的改变存在一定的关系,值得关注。此外,长江营养盐通量的增加与近海营养盐结构失衡或将促使中国近海有害藻华顽固存在(Wang et al, 2021a),影响近海生态系统稳定。
当前,流域日益增强的人类活动显著提高了河流N、P的浓度水平以及输送通量。《长江保护法》的正式实施(2021年3月1日)使长江大保护进入了依法保护的新阶段;长江10年禁渔禁止了河流生产性捕捞行为,必然会促进淡水养殖规模的进一步扩大,从而势必增加河流N、P的来源,提高水体中N、P的浓度,造成河流—河口富营养化趋势的进一步加强。近些年,国家采取多项措施,逐步消减农业化肥的使用,这在一定程度上减缓了长江N、P浓度升高的趋势。不过,养殖规模的变化可能打破化肥使用减少引起的营养盐通量和结构的变化,并对N、P营养盐比例的失衡产生不确定的影响。如前所述,当前有关水产养殖N、P污染的研究大多研究集中于较小的区域(如湖泊),研究的时间跨度也较短,且难以进行定量的评估和趋势分析。因此,结合统计数据,通过模型计算,可以极大地拓展研究的时空尺度,有助于加深对我国水产养殖污染现状及变化趋势的了解,并有针对性的开展养殖规划与环境保护等工作。
因此,在长江流域层面上需要在科学研究的基础上,对水产养殖的规模与模式进行规范性操作,完善相关法律法规、提高公众环境意识。同时,应加强陆海相互作用研究,在以海统陆的前提下,科学规划养殖区,尽可能通过优化养殖模式等有效措施降低陆源污染物入海通量,减少河口生态灾害风险。
3 结论(1) 2003—2018年长江流经主要省份淡水养殖引起的TN和TP年排放量分别为(468.41±179.22)和(52.02±24.08) Gg/yr。淡水养殖引起的营养盐排放量最大的省份为湖北省,其次为江西省和湖南省。
(2) 2003—2018年长江主要省份淡水养殖的TN与TP排放量上、中与下游整体均呈现稳定增加的趋势,其中,中游地区N与P的增长最为显著。养殖产生的N、P比在全流域整体表现为缓慢下降的趋势。
(3) 2003—2018年间长江流域淡水养殖的年均TN和TP排放量占长江流域2010年TN和TP排放量的7.93%和13.65%,淡水养殖污染排放的TN和TP在长江流域占比逐渐增加的趋势不可小觑。
致谢: 感谢荷兰乌特勒支大学王俊杰博士在模式计算和数据分析方面的支持!工作设计与推进得到了农村农业部长江流域渔政监督管理办公室等单位的大力支持,在此一并表示感谢!
BAI H Y, LI Q F, ZHANG Y, et al. Seasonal variation in nutrients and evaluation of eutrophication in the aquaculture areas in the middle water areas of Xiangshan Harbor. Progress in Fishery Sciences, 2018, 39(6): 24-30 [白怀宇, 李秋芬, 张艳, 等. 象山港中部养殖海区营养盐的季节变化及富营养化. 渔业科学进展, 2018, 39(6): 24-30] |
BEUSEN A H W, BOUWMAN A F, VAN BEEK L P H, et al. Global riverine N and P transport to ocean increased during the 20 th century despite increased retention along the aquatic continuum. Biogeosciences, 2016, 13(8): 2441-2451 DOI:10.5194/bg-13-2441-2016 |
BEUSEN A H W, VAN BEEK L P H, BOUWMAN A F, et al. Coupling global models for hydrology and nutrient loading to simulate nitrogen and phosphorus retention in surface water–description of IMAGE-GNM and analysis of performance. Geoscientific model development, 2015, 8(12): 4045-4067 DOI:10.5194/gmd-8-4045-2015 |
BOUWMAN A F, BEUSEN A H W, BILLEN G. Human alteration of the global nitrogen and phosphorus soil balances for the period 1970-2050. Global Biogeochemical Cycles, 2009, 23(4): GB0A04 |
BOUWMAN A F, BEUSEN A H W, GLIBERT P M, et al. Mariculture: significant and expanding cause of coastal nutrient enrichment. Environmental Research Letters, 2013b, 8(4): 044026 DOI:10.1088/1748-9326/8/4/044026 |
BOUWMAN A F, BEUSEN A H W, LASSALETTA L, et al. Lessons from temporal and spatial patterns in global use of N and P fertilizer on cropland. Scientific Reports, 2017, 7(1): 1-11 DOI:10.1038/s41598-016-0028-x |
BOUWMAN A F, BEUSEN A H W, OVERBEEK C C, et al. Hindcasts and future projections of global inland and coastal nitrogen and phosphorus loads due to finfish aquaculture. Reviews in Fisheries Science, 2013a, 21: 112-156 DOI:10.1080/10641262.2013.790340 |
BOUWMAN A F, KRAM T, Goldewijk K K. Intergrated modelling of global environmenthal change: An overview of IMAGE 2.4. Bilthoven: Netherlands Environmental Assessment Agency, 2006
|
BOUWMAN A F, PAWŁOWSKI M, LIU C, et al. Global hindcasts and future projections of coastal nitrogen and phosphorus loads due to shellfish and seaweed aquaculture. Reviews in Fisheries Science, 2011, 19: 331-357 DOI:10.1080/10641262.2011.603849 |
Bureau of Fisheries, Ministry of Agriculture and Rural Affairs, National Fisheries Technology Extension Center, China Society of Fisheries. China fishery statistical yearbook 2018—2019. Beijing: China Agriculture Press, 2019, 2020 [农业农村部渔业渔政管理局, 全国水产技术推广总站, 中国水产学会. 2018—2019中国渔业统计年鉴. 北京: 中国农业出版社, 2019, 2020]
|
DIAZ R J, Rosenberg R. Spreading dead zones and consequences for marine ecosystems. Science, 2008, 321(5891): 926-929 DOI:10.1126/science.1156401 |
Food and agriculture organization of the united nations. Aquaculture production 1950-2010. Fishstat Plus-Universal software for fishery statistical time series by Fisheries and Aquaculture Information and Statistics Service. Rome, 2012. http://www.fao.org/fishery/statistics/software/fishstat/en (accessed in Jan 2021)
|
GALLOWAY J N, TOWNSEND A R, ERISMAN J W, et al. Transformation of the nitrogen cycle: Recent trends, questions, and potential solutions. Science, 2008, 320(5878): 889-892 DOI:10.1126/science.1136674 |
GAO L F, WU J Y, GE X D, et al. Pollution load characteristics of freshwater aquaculture in the Yangtze River Economic Belt. Journal of Huazhong Agricultural Unviersity, 2021, 40(3): 64-74 [高立方, 吴静颖, 葛小东, 等. 长江经济带淡水养殖污染负荷特征分析. 华中农业大学学报, 2021, 40(3): 64-74] |
GARNIER J, BEUSEN A, THIEU V, et al. N: P: Si nutrient export ratios and ecological consequences in coastal seas evaluated by the ICEP approach. Global Biogeochemical Cycles, 2010, 24: GB0A05 |
GLIBERT P M, BURFORD M A. Globally changing nutrient loads and harmful algal blooms: recent advances, new paradigms, and continuing challenges. Oceanography, 2017, 30(1): 58-69 DOI:10.5670/oceanog.2017.110 |
GLIBERT P M. Eutrophication, harmful algae and biodiversity- Challenging paradigms in a world of complex nutrient changes. Marine Pollution Bulletin, 2017, 124(2): 591-606 DOI:10.1016/j.marpolbul.2017.04.027 |
GUO F, ZHAO J, CHEN J F, et al. Nitrogen and phosphorous pollution in shellfish culture areas of Jiaozhou Bay. Progress in Fishery Sciences, 2012, 33(5): 116-122 [过锋, 赵俊, 陈聚法, 等. 胶州湾贝类养殖区氮、磷污染现状及动态变化. 渔业科学进展, 2012, 33(5): 116-122 DOI:10.3969/j.issn.1000-7075.2012.05.018] |
GUO Y J, LI J W, LUO Z L, et al. Characteristics of zooplankton community in aquaculture areas of Liusha Bay. Progress in Fishery Sciences, 2015, 36(5): 8-18 [郭永坚, 李俊伟, 罗昭林, 等. 流沙湾水产养殖区浮游动物群落特征. 渔业科学进展, 2015, 36(5): 8-18] |
HUANG J C, ZHANG Y J, BING H J, et al. Characterizing the river water quality in China: Recent progress and on-going challenges. Water Research, 2021, 117309 |
HUANG Y Y, CIAIS P, GOLL D S, et al. The shift of phosphorus transfers in global fisheries and aquaculture. Nature communications, 2020, 11(1): 1-10 DOI:10.1038/s41467-019-13993-7 |
LI D J, ZHANG J, HUANG D J, et al. Oxygen depletion off the Changjiang (Yangtze River) Estuary. Science in China Series D: Earth Sciences, 2002, 45(12): 1137-1146 DOI:10.1360/02yd9110 |
LIU C F, QI Z R, HE J, et al. Environmental friendship aquaculture-Zero discharge integrated recirculating aquaculture systems. Journal of Dalian Fisheries University, 2002, 17(3): 220-226 [刘长发, 綦志仁, 何洁, 等. 环境友好的水产养殖业—零污水排放循环水产养殖系统. 大连水产学院学报, 2002, 17(3): 220-226 DOI:10.3969/j.issn.1000-9957.2002.03.008] |
LIU G F, XU P, WU T, et al. Present condition of aquaculture nitrogen and phosphorus environmental pollution and future development strategy. Jiangsu Journal of Agricultural Sciences, 2018, 34(1): 225-233 [刘国锋, 徐跑, 吴霆, 等. 中国水产养殖环境氮磷污染现状及未来发展思路. 江苏农业学报, 2018, 34(1): 225-233 DOI:10.3969/j.issn.1000-4440.2018.01.033] |
LIU M, YUAN J L, NI M, et al. A comparative study on nitrogen and phosphorus budget and aquaculture effect of Micropterus salmoides in two modes. Oceanologia et Limnologia Sinica, 2021, 52(3): 718-728 [刘梅, 原居林, 倪蒙, 等. 大口黑鲈(Micropterus salmoides)不同养殖模式氮磷收支及养殖效果研究. 海洋与湖沼, 2021, 52(3): 718-728] |
LIU X C, BEUSEN A H W, VAN BEEK L P H, et al. Exploring spatiotemporal changes of the Yangtze River (Changjiang) nitrogen and phosphorus sources, retention and export to the East China Sea and Yellow Sea. Water research, 2018, 142: 246-255 DOI:10.1016/j.watres.2018.06.006 |
Ministry of Agriculture and Rural Affairs. Maintain the order of feed production and protect the quality and safety of aquaculture products-the Ministry of Agriculture and Rural Affairs, Animal Husbandry and Veterinary Bureau leading official meets the press on the regulations about home-made feed by feeders, (2020-6-17)[2020-6-17]. http://www.gov.cn/zhengce/2020-06/17/content_5519851.htm [农业农村部. 维护饲料生产使用秩序保障养殖产品质量安全—农业农村部畜牧兽医局有关负责人就养殖者自行配制饲料有关规定答记者问[EB/OL], 2020-6-17 http://www.gov.cn/zhengce/2020-06/17/content_5519851.htm]
|
MU Y L, SHI H T, ZHAO B W, et al. Pollution load of nitrogen and phosphorus from cage aquaculture in Yangcheng Lake. China Water & Wastewater, 2018, 34(21): 86-91 [穆玉林, 石鸿韬, 赵博文, 等. 阳澄湖围网养殖氮磷污染负荷分析. 中国给水排水, 2018, 34(21): 86-91] |
NEWBOLD J D, ELWOOD J W, O'NEILL R V, et al. Measuring nutrient spiralling in streams. Canadian Journal of Fisheries and Aquatic Sciences, 1981, 38(7): 860-863 DOI:10.1139/f81-114 |
PENG L Y, TI C P, LI H P, et al. Estimates and characteristics of pollutant discharge from pond cultures in the Taihu Basin. Journal of Lake Sciences, 2020, 32(1): 70-78 [彭凌云, 遆超普, 李恒鹏, 等. 太湖流域池塘养殖污染排放估算及其空间分布特征. 湖泊科学, 2020, 32(1): 70-78] |
ROUSSEAU V, BECQUEVORT S, PARENT J Y, et al. Trophic efficiency of the planktonic food web in a coastal ecosystem dominated by Phaeocystis colonies. Journal of Sea Research, 2000, 43(3-4): 357-372 DOI:10.1016/S1385-1101(00)00018-6 |
STATE OCEANIC ADMINISTRATION. Bulletin of China's Marine Environmental Status of China. Tianjin: National Marine Data and Information Service, 2002~2009 [国家海洋局. 中国海洋环境质量公报. 天津: 国家海洋信息中心, 2002-2009]
|
STATE STATISTICS BUREAU. China Statistical Yearbook. Beijing: China Statistics Press, 2019 [国家统计局. 中国统计年鉴. 北京: 中国统计出版社, 2019]
|
STEHFEST E, VAN VUUREN D, BOUWMAN L, et al. Integrated assessment of global environmental change with IMAGE 3.0: Model description and policy applications. Netherlands: Environmental Assessment Agency (PBL), 2014
|
SUN Y F, WANG F, LIU F, et al. Nitrogen and phosphorus budgets in Grass Carp, Silver Carp, and Common Carp culture systems. Journal of Fishery Sciences of China, 2015, 22(3): 450-459 [孙云飞, 王芳, 刘峰, 等. 草鱼与鲢、鲤不同混养模式系统的氮磷收支. 中国水产科学, 2015, 22(3): 450-459] |
TANG Q S, HAN D, MAO Y Z, et al. Species composition, non-fed rate and trophic level of Chinese aquaculture. Journal of Fishery Sciences of China, 2016, 23(4): 729-758 [唐启升, 韩冬, 毛玉泽, 等. 中国水产养殖种类组成、不投饵率和营养级. 中国水产科学, 2016, 23(4): 729-758] |
TURNER R E, QURESHI N, RABALAIS N N, et al. Fluctuating silicate: nitrate ratios and coastal plankton food webs. Proceedings of the National Academy of Sciences of the United States of America, 1998, 95(22): 13048-13051 DOI:10.1073/pnas.95.22.13048 |
VAN BEEK L P H, WADA Y, BIERKENS M F P. Global monthly water stress: 1. Water balance and water availability. Water Resources Research, 2011, 47(7): W07517 |
WANG B D. Hydromorphological mechanisms leading to hypoxia off the Changjiang estuary. Marine Environmental Research, 2009, 67(1): 53-58 |
WANG H, YAN H Y, ZHOU F N, et al. Dynamics of nutrient export from the Yangtze River to the East China sea. Estuarine, Coastal and Shelf Science, 2019a, 229: 106415 |
WANG J J, BEUSEN A H W, LIU X C, et al. Aquaculture production is a large, spatially concentrated source of nutrients in Chinese freshwater and coastal seas. Environmental Science & Technology, 2019b, 54(3): 1464-1474 |
WANG J J, BOUWMAN A F, LIU X C, et al. Harmful algal blooms in Chinese coastal waters will persist due to perturbed nutrient ratios. Environmental Science & Technology Letters, 2021a, 8(3): 276-284 |
WANG K, CAI W J, CHEN J, et al. Climate and human-driven variability of summer hypoxia on a large river-dominated shelf as revealed by a hypoxia index. Frontiers in Marine Science, 2021b, 8: 634184 |
WANG M L, XIONG X, HE C, et al. Sources of sedimentary organic matter from the cage fish farm in Lake Poyang, China. Journal of Lake Sciences, 2021, 33(01): 158-167 [王毛兰, 熊鑫, 何昶, 等. 鄱阳湖网箱养殖区沉积物有机质来源分析. 湖泊科学, 2021, 33(01): 158-167] |
WANG Y Y, SUN Y, ZHAO Y W. Current status and prevention measures of agricultural non-point source pollution in Taihu Lake basin of Jiangsu Province. Acta Agriculture Jiangxi, 2008, 20(8): 118-121 [王艳艳, 孙勇, 赵言文. 江苏省太湖流域农业面源污染现状分析及防治措施. 江西农业学报, 2008, 20(8): 118-121] |
WOLLHEIM W M, VÖRÖSMARTY C J, BOUWMAN A F, et al. Global N removal by freshwater aquatic systems using a spatially distributed, within-basin approach. Global Biogeochemical Cycles, 2008, 22(2): B2026 |
WU S K. Ecological studies on TN: TP ratio, phytoplankton and microcystins in 33 shallow lakes in the middle and lower reaches of the Yangtze River. Doctoral Dissertation of Institute of Hydrobiology, Chinese Academy of Sciences, 2007 [吴世凯. 长江中下游地区33个浅水湖泊的N、P比、浮游植物和微囊藻毒素的生态学研究. 中国科学院水生生物研究所博士研究生学位论文, 2007]
|
WURTSBAUGH W A, PAERL H W, DODDS W K. Nutrients, eutrophication and harmful algal blooms along the freshwater to marine continuum. Wiley Interdisciplinary Reviews: Water, 2019, 6(5): e1373 |
XIA B, CHEN B J, CUI Y, et al. Distribution and source of organic carbon in Sanggou Bay in summer. Progress in Fishery Sciences, 2013, 34(1): 44-49 [夏斌, 陈碧鹃, 崔毅, 等. 夏季桑沟湾养殖水域有机碳的平面分布特征及其来源分析. 渔业科学进展, 2013, 34(1): 44-49] |
XIA B, MA S S, CUI Y, et al. Distribution of temperature, salinity, dissolved oxygen, nutrients and their relationships with green tide in Enteromorpha prolif era outbreak area of the Yellow Sea. Progress in Fishery Sciences, 2009, 30(5): 94-101 [夏斌, 马绍赛, 崔毅, 等. 黄海绿潮(浒苔)暴发区温盐、溶解氧和营养盐的分布特征及其与绿潮发生的关系. 渔业科学进展, 2009, 30(5): 94-101] |
XIN Y T. Study on the pollution load calculation and polluting effect of barier net aquiculture in Yangcheng Lake. Master's Thesis of Hohai University, 2007 [辛玉婷. 阳澄湖围网养殖污染负荷计算及其污染效应研究. 河海大学硕士研究生学位论文, 2007]
|
XU D H, CHEN B J, JIANG T, et al. Temporal and spatial variation characteristics of water nutrients and eutrophication evaluation in aquaculture water areas of Sanggou Bay. Progress in Fishery Sciences, 2017, 38(3): 1-11 [徐东会, 陈碧鹃, 江涛, 等. 桑沟湾养殖海域营养盐时空分布特征及富营养化评价. 渔业科学进展, 2017, 38(3): 1-11] |
ZHAO J, LUO Q, DENG H, et al. Opportunities and challenges of sustainable agricultural development in China. Philosophical Transactions of the Royal Society B: Biological Sciences, 2008, 363: 893-904 |


