2. 崂山实验室海洋渔业科学与食物产出过程功能实验室山东 青岛 266071;
3. 山东长岛近海渔业资源国家野外科学观测研究站 山东 烟台 265800
2. Laboratory for Marine Fisheries Science and Food Production Processes, Laoshan Laboratory, Qingdao, Shandong 266071, China;
3. Shandong Changdao Fishery Resources National Observation and Research Station, Yantai, Shandong 265800, China
黄海是我国的重要渔场,主要渔业经济种类约有50余种,年产量超过万吨的鱼类14种、甲壳类5种、头足类4种(李晓炜等, 2018)。充分了解黄海渔业资源多样性和生物量时空变动趋势,是黄海渔业资源可持续利用的重要前提,也是实现黄海渔业资源适应性管理的重要一环。目前,学者们对黄海渔业资源生物多样性指数有大量研究(吴强等, 2012、2015; 单秀娟等, 2013、2014; 逄志伟等, 2015),但对其时空分布鲜有报道。对于渔业种类,气候变化可能导致高纬度海域渔获量的增加和热带海域渔获量的减少(尤其太平洋) (Cheung et al, 2010),而全球变暖则是主导因素(Cheung et al, 2013)。因此,通过建立渔获量平均温度(mean temperature of the catch, MTC)指数,可反映全球变暖对渔获量时空分布的影响。Cheung等(2013)利用MTC分析发现,全球尺度海洋渔业渔获物组成的变化与海水温度息息相关,高纬度海域温水种渔获量的主导地位提高,热带海域亚热带种类的渔获量比例下降。在中国海(Liang et al, 2018)和地中海(Tsikliras et al, 2014)等中尺度海域也有类似的发现,而对于MTC是否能反映黄海小尺度海域中渔获量与海水温度的关系却鲜有报道。为此,需深入研究海水温度升高对黄海渔业生物量时空分布的影响。本研究利用2000、2009和2018年每年秋季(10月)渔业资源调查数据,结合海表面温度(sea surface temperature, SST)遥感数据,对黄海渔业种类组成、生物多样性时空分布及其与SST的关系,生物量时空分布和生物量平均温度(mean temperature of the biomass, MTB)的时空分布进行分析,以期为黄海渔业资源可持续利用提供支撑。
1 材料与方法 1.1 数据来源数据来自“北斗号”调查船于2000、2009和2018年每年秋季(10月)在黄海进行的渔业资源底拖网调查。底拖网网口高度为6.1~8.3 m,网口宽度约为25 m,囊网网目为24 mm,平均拖速为3.0 kn,拖网时间约为1 h,现场对种类进行鉴定,资源密度标准化为单位时间丰度(ind./h)或生物量(kg/h)。为确保数据的年间可比较性,每年分别在相同渔区进行渔业资源调查,3年累计调查117个站位,每年各39个站位。将各调查站位栅格化为0.5°×0.5°的研究单元,得到各年份相同的单元格数量及位置。选取生物量占比超过0.05%的鱼类、甲壳类和头足类作为黄海渔业种群空间分布格局的表征种类。
考虑到SST是目前最易获取的海洋环境参数,且已证明对渔业生物量有重要影响(Cheung et al, 2010、2013),本研究利用SST分析并验证其对黄海渔业生物多样性研究的可行性。各年月平均SST来自https://oceanwatch.pifsc.noaa.gov/,空间分辨率为0.04°×0.04°,为匹配调查数据,将SST的空间分辨率网格化为0.5°×0.5°。
1.2 数据分析 1.2.1 生物多样性指数Margalef指数是用来衡量物种丰富度的指数。Shannon-Wiener多样性指数是评价生物群落物种多样性的重要指标,其同时考虑了物种丰富度和均匀度2个维度,是应用最广泛的生物多样性指数。Berger-Parker指数受物种丰富度和均匀度的影响,物种丰富度越高且各种类丰度相同时,Berger-Parker指数越大(Jørgensen et al, 2008)。
Berger-Parker指数和Margalef指数对物种丰富度的变化非常敏感,对群落多样性变化的区分能力较强,与Shannon-Wiener指数有互补性,可结合使用。本研究选择上述3种指数,分别计算各单元格渔业生物种类数,并根据种类数和丰度计算多样性指数,公式如下(Margalef, 1958; Wilhm, 1968; Berger et al, 1970):
Margalef丰富度指数
Shannon-Wiener多样性指数
Berger-Parker指数
式中,S为种类数;N为总个体数;
物种累积曲线用于描述不同站点数量情况下物种丰富度状况,记录连续站点调查时新物种出现速率,是分析物种组成和预测物种丰富度的有效工具。通常,在开始时,随着站点数量的不断增加,大量物种被发现,物种累积曲线急剧上升;随后,站点数量达到一定水平,物种累积速率下降,曲线趋于平缓。因此,可通过物种累积曲线判断站点数量是否充足,曲线急剧上升,说明站点数量不足,需要增加调查站位;反之,表明站点数量充足,可以进行数据分析(Ugland et al, 2003; 孙志强等, 2012)。
Rényi多样性曲线可提供丰富度和均匀度信息,并按顺序对多样性排序,是常用且重要的多样性排序技术之一,但该曲线不再提供各物种的比例信息,计算公式如下(Kindt et al, 2005):
| $ {H_\alpha } = \frac{{\ln \left({\sum\limits_{i = 1}^S {p_i^\alpha } } \right)}}{{1 - \alpha }} $ |
式中,Ha为Rényi多样性曲线取值;S为种类数;
随着全球变暖,渔业生物的空间分布会随之改变,主要表现为高纬度渔获量增加和低纬度渔获量的减少(Cheung et al, 2010)。SST作为反映全球变暖的重要参数,可结合渔获量建立MTC指数,进而解析全球变暖对渔获量时空分布的影响(Cheung et al, 2013),目前,MTC指数已被应用到中国海(Liang et al, 2018)和地中海(Tsikliras et al, 2014)的渔业研究中。本研究以渔业资源调查的生物量代替渔业生产中的渔获量计算MTB,它是根据各种类秋季平均偏好温度和每年秋季生物量计算,最终得出各站位的MTB值。
| $ {\text{MT}}{{\text{B}}_j} = \frac{{\sum\limits_i^n {{T_i}} {B_{ij}}}}{{\sum\limits_i^n {{B_{ij}}} }} $ |
式中,
数据处理和图形绘制均由R语言完成。生物多样性指数由“BiodiversityR”程序包中的“diversityresult”函数计算;多样性曲线由“BiodiversityR”程序包中的“renyicomp”和“renyicomp. long”函数完成;物种累积曲线由“BiodiversityR”程序包中的“accumcomp”函数完成(Kindt et al, 2005)。环境因子与种类数和多样性指数之间的线性回归分析由基础程序包中的“lm”函数完成(R Core Team, 2021)。绘图由“ggplot2”程序包完成(Wickham, 2016)。
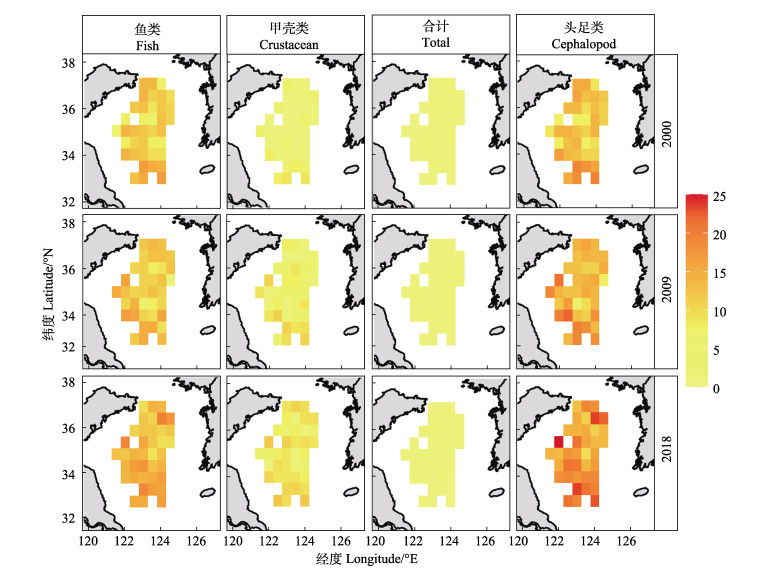
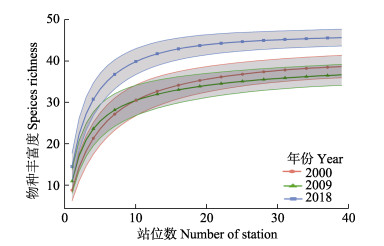
2 结果 2.1 种类组成对调查种类进行筛选后,发现2000年的表征种类共39种(鱼类32种、甲壳类6种、头足类1种),2009年的表征种类共37种(鱼类27种、甲壳类9种、头足类1种),2018年的表征种类共46种(鱼类32种、甲壳类13种、头足类1种)。根据物种数的时空分布发现(图 1),黄海南部鱼类种数高于黄海北部,且在33°~34°N附近鱼类种数最多;34°N以南甲壳类种数较多,2018年甲壳类种数最多、2000年最低;各年份仅发现太平洋褶柔鱼(Todarodes pacificus) 1种头足类的生物量大于总生物量的0.05%。总体看来,2018年物种数最多,鱼类是影响物种数分布的主要因素;除头足类外,各类别均存在种类数随年份向北增多的趋势(图 1和图 2)。根据物种累积曲线,物种累积速率在站位数达到20时已十分缓慢,因此,各年份需随机选择约20个站位即可表征黄海种类数(图 2)。
|
图 1 秋季黄海渔业生物物种丰富度(种类数)时空分布 Fig.1 Spatiotemporal distribution of species richness (number) for fishery resources in the Yellow Sea in fall |
|
图 2 秋季黄海渔业生物物种累积曲线年间变化 Fig.2 Species accumulation curve of fishery resources in the Yellow Sea in fall |
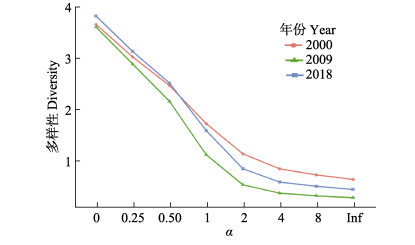
Rényi多样性曲线在2000、2009和2018年均呈现由左向右下降的趋势,表明黄海各种类并非均匀分布。与2000和2018年相比,2009年具有较低的多样性,即具有较低的丰富度和均匀度;而2000和2018年存在交叉,因此,无法从该轮廓中比较2个年份的多样性(图 3)。根据α=0时的多样性,2000—2009年间物种数量下降,随后在2018年逐渐增加;根据α=∞时的多样性,2009年绝对优势种占比最高,而2000年绝对优势种占比最低,优势种比例越高则均匀度越低。
|
图 3 秋季黄海渔业生物Rényi多样性曲线 Fig.3 Rényi diversity profile in the Yellow Sea in fall |
各年份表征黄海渔业生物总生物量的空间分布存在较大差异(图 4),2000年高生物量站位占比最低,仅占1/3,主要分布在35°~37°N;2009和2018年高生物量站位占比约为1/2,分布相对均匀。从生物量占比看,各年份鱼类占比均高于70%,总体呈先下降后上升的趋势,甲壳类占比从2000年的11.45%增至2009和2018年的25%以上,头足类占比最小(< 1%)且在不断下降(表 1)。

|
图 4 秋季黄海渔业生物总生物量时空分布 Fig.4 Spatiotemporal distribution of total biomass for fishery resources in the Yellow Sea in fall |
|
|
表 1 秋季黄海各类型渔业资源生物量占比 Tab.1 Biomass proportion of different type of fishery resources in the Yellow Sea in fall |
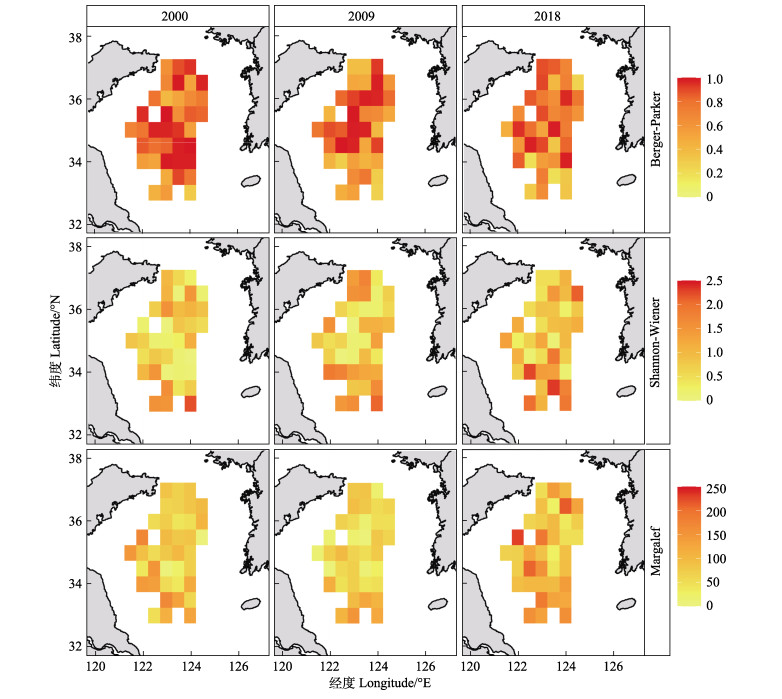
不同生物多样性指数的空间分布有较大差异,同一多样性指数的空间分布也有年间差异(图 5)。相同年份的Berger-Parker指数和Shannon-Wiener多样性指数的空间分布趋势相反,即Berger-Parker指数高值区的Shannon-Wiener多样性指数较低,Shannon-Wiener多样性指数的高值区主要分布于黄海南部,Berger- Parker指数高值区主要分布于黄海中南部。Margalef丰富度指数高值区则主要分布在黄海南部。对于不同年份的同一多样性指数,与其他年份相比,2018年的Berger-Parker指数减小,而Margalef丰富度指数和Shannon-Wiener多样性指数则增大。
|
图 5 秋季黄海渔业生物多样性指数时空分布 Fig.5 Spatiotemporal distribution of biodiversity for fishery resources in the Yellow Sea in fall |
SST与所有生物多样性指数均不存在显著的线性关系(P > 0.05),且r2均极小,即二者的线性关系相对较弱。SST与种类数、Margalef丰富度指数、Shannon- Weiner多样性指数呈弱正相关,而与Berger-Parker指数则呈弱负相关(表 2)。
|
|
表 2 秋季黄海海表面温度与生物多样性指数线性回归分析 Tab.2 Linear regression analysis between SST and biodiversity index in the Yellow Sea in fall |
MTB总体呈现西南高、东北低的趋势,且在34°N附近变化明显;深水区MTB低于近岸;MTB最小值出现在黄海北部,最大值出现在调查海域南端(图 6)。
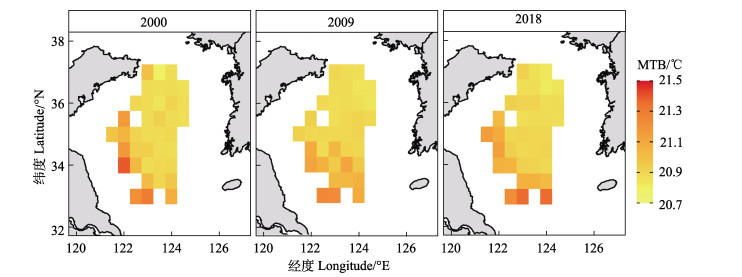
|
图 6 秋季黄海生物量平均温度(MTB)时空分布 Fig.6 Spatiotemporal distribution of mean temperature of the biomass in the Yellow Sea in fall |
通过筛选生物量占比超过0.05%的种类作为黄海渔业的表征种类,发现在2000—2018年间,鱼类表征种类减少5种后又恢复至原有数目,甲壳类增加7种,头足类1种保持不变。苏程程等(2021)对1985—2018年黄海鱼类种群研究发现,2018年鱼类种类数为历年最多,鱼类优势种生物量占比呈先增大后减小的趋势(1985、2001、2009和2018年分别为30.35%、72.72%、80.39%和53.99%)。本研究发现,鱼类生物量占比减少,而甲壳类生物量占比增加(表 1)。Wu等(2019)对1985—2014年10月的黄海渔业资源生物量分析发现,种类组成存在2个阶段的变化:第1阶段为1958—2000年,优势种类由底层高价值种类向中上层低价值种类转变;第2阶段为2000—2014年,优势种类由中上层低价值种类向底层低价值种类转变。此外,无脊椎动物尤其是甲壳类的优势度也逐渐凸显(Wu et al, 2019),这与本研究结果一致。
2018年表征种类数最多(46种),可能原因为优势种类生物量下降,使得其他种类优势度得以凸显,低纬度种类向北移动并占据一定的生态位。尽管不同年份生物量绝对优势种均为细纹狮子鱼(Liparis tanakae),但其生物量占比有较大差异:2000年占27.00%,2009年占37.85%,2018年占22.82%。
3.2 生物多样性及其与SST的关系物种累积曲线中,决定物种丰富度的因素之一为样本大小,即站位数(Kindt et al, 2005)。为此,本研究选择相同站位进行了年代际调查,各年份分别选择39个站位,共117个站位。
对于Rényi多样性曲线,它可以提供物种丰富度和均匀度信息,并对多样性排序。若该轮廓中的曲线为一条水平直线,表明各种类均匀度相同,曲线越陡说明均匀度越低(Kindt et al, 2005),结合多样性指数的空间分布结果(图 3和图 5),发现本研究中各种类空间分布差异较大。根据α=0时的纵坐标值,可计算出各子数据集的物种数,即纵坐标的自然指数。根据α=∞时的纵坐标值,可计算出丰度的绝对优势种比例,即为纵坐标自然指数的倒数。在本研究筛选的表征种中,脊腹褐虾(Crangon affinis)的丰度在各年份中均占绝对优势,其中,2000年占53.25%,2009年占75.40%,2018年占63.81%。
对于生物多样性指数的空间分布,本研究发现,Berger-Parker指数和Shannon-Wiener多样性指数的空间分布趋势相反,这与前人发现的二者呈显著负相关(r=–0.808,P < 0.01)的结果一致(苏宇乔等, 2017)。本研究中,与2000和2009年相比,2018年Berger- Parker指数减小,Margalef丰富度指数、Shannon- Wiener多样性指数增大,这与2018年物种数的骤增、生物量优势种及丰度优势种占比的骤减有关。由此看出,当一定区域内优势种的占比下降时,其物种数和生物多样性会增加。
多样性指数与SST的线性关系相对较弱,这与采样方式和范围有较大关系。本研究利用底拖网进行调查,主要采集底层动物,物种数对SST的变化不敏感,且采样纬度范围仅跨越4°,SST并不存在较大差异。对于黄海的底栖动物,可按照适宜栖息温度将其划分为冷水种、狭温性暖水种和广温性暖水种;在近岸海域,分布着广温性暖水种;在水深 > 40 m或50 m的深水区,分布着大量冷水种,分布范围向南一般不超过33°N (刘瑞玉等, 1963)。在黄海,冷温性和广温性种类居多,加之SST跨度较小,是多样性指数与SST线性关系较弱的主要原因。因此,今后应加强生物多样性与底层环境因子关系的研究。
3.3 生物量平均温度(MTB)的时空分布高纬度海域的MTB低于低纬度海域(图 6),这可能是由于海水温度升高、海平面上升、溶解氧下降和海洋酸化等气候变化在不断影响着海洋生态系统,导致生物多样性、时空分布格局和栖息环境等均发生了不同程度的改变(单秀娟等, 2016、2017)。调查海域东北部是黄海冷水团的主要分布区,水温较低,是黄海冷温性海洋生物较为适宜的栖息地,而沿海区域因水深较浅,受光照、潮汐等影响,水温较高,这是MTB西南高、东北低的主要原因。受全球变暖的影响,渔业资源生物量也会受“热带化”的影响,表现为非热带海域暖水种优势度增加(Perry et al, 2005; Wernberg et al, 2013)。Cheung等(2013)发现,高纬度海域温水种渔获量的主导地位提高,热带海域亚热带种类的渔获量比例下降。在中国海(Liang et al, 2018)和地中海(Tsikliras et al, 2014)等区域性海域也有类似的发现。本研究中,虽然渔业生物种类数随时间有向北增加的趋势(图 1),但并未在渔业生物的生物量和生物量平均温度方面发现这一趋势(图 4和图 6),这可能与本研究海域尺度较小、海水温度变化不明显有关。
BERGER W H, PARKER F L. Diversity of planktonic foraminifera in deep-sea sediments. Science, 1970, 168: 1345-1347 DOI:10.1126/science.168.3937.1345 |
CHEUNG W W L, LAM V W Y, SARMIENTO J L, et al. Large- scale redistribution of maximum fisheries catch potential in the global ocean under climate change. Global Change Biology, 2010, 16(1): 24-35 DOI:10.1111/j.1365-2486.2009.01995.x |
CHEUNG W W L, WATSON R, PAULY D. Signature of ocean warming in global fisheries catch. Nature, 2013, 497(7449): 365-368 DOI:10.1038/nature12156 |
JØRGENSEN, S E, FATH, B D. Encyclopedia of ecology. Elsevier Science, 2008
|
KINDT R, COE R. Tree diversity analysis: A manual and software for common statistical methods for ecological and biodiversity studies. World Agroforestry Centre (ICRAF), Nairobi (Kenya). 2005, ISBN 92-9059-179-X, http://www.worldagroforestry.org/output/tree-diversity-analysis
|
LI X W, ZHAO J M, LIU H, et al. Status, problems and optimized management of spawning, feeding, overwintering grounds and migration route of marine fishery resources in Bohai Sea and Yellow Sea. Transactions of Oceanology and Limnology, 2018(5): 147-157 [李晓炜, 赵建民, 刘辉, 等. 渤黄海渔业资源三场一通道现状、问题及优化管理政策. 海洋湖沼通报, 2018(5): 147-157] |
LIANG C, XIAN W W, PAULY D. Impacts of ocean warming on China´s fisheries catches: An application of "mean temperature of the catch" concept. Frontiers in Marine Science, 2018, 5: 00026 DOI:10.3389/fmars.2018.00026 |
LIU R Y, XU F S. Preliminary studies on the benthic fauna of the Yellow Sea and the East China Sea. Oceanologia et Limnologia Sinica, 1963, 5(4): 306-321 [刘瑞玉, 徐凤山. 黄、东海底栖动物区系的特点. 海洋与湖沼, 1963, 5(4): 306-321] |
MARGALEF R. Information theory in ecology. General System, 1958, 3: 36-71 |
PANG Z W, LI X S, YING Y P, et al. Shrimp community structure and its relationships with environmental factors in the Yellow Sea in summer. Chinese Journal of Applied Ecology, 2015, 26(11): 3509-3515 [逄志伟, 李显森, 应一平, 等. 黄海夏季虾类群落结构及其与环境因子的关系. 应用生态学报, 2015, 26(11): 3509-3515 DOI:10.13287/j.1001-9332.20150812.007] |
PERRY A L, LOW P J, ELLIS J R, et al. Climate change and distribution shifts in marine fishes. Science, 2005, 308(5730): 1912-1915 DOI:10.1126/science.1111322 |
R CORE TEAM. R: A language and environment for statistical computing. R Foundation for Statistical Computing, Vienna, Austria, 2021. https://www.R-project.org/
|
SHAN X J, CHEN Y L, DAI F Q, et al. Variations in fish community structure and diversity in the sections of the central and southern Yellow Sea. Acta Ecologica Sinica, 2014, 34(2): 377-389 [单秀娟, 陈云龙, 戴芳群, 等. 黄海中南部不同断面鱼类群落结构及其多样性. 生态学报, 2014, 34(2): 377-389] |
SHAN X J, CHEN Y L, JIN X S, et al. Reshaping the distribution of fish abundance by climate change: A case study in the Yangtze River Estuary. Progress in Fishery Sciences, 2016, 37(6): 1-15 [单秀娟, 陈云龙, 金显仕, 等. 气候变化对长江口鱼类资源密度分布的重塑作用. 渔业科学进展, 2016, 37(6): 1-15] |
SHAN X J, CHEN Y L, JIN X S. Projecting fishery ecosystem health under climate change scenarios: Yangtze River Estuary and Yellow River Estuary. Progress in Fishery Sciences, 2017, 38(2): 1-7 [单秀娟, 陈云龙, 金显仕. 气候变化对长江口和黄河口渔业生态系统健康的潜在影响. 渔业科学进展, 2017, 38(2): 1-7] |
SHAN X J, SUN P F, JIN X S, et al. Seasonal variations of fishery resource structure in the sections of the southern Yellow Sea. Journal of Fisheries of China, 2013, 37(3): 425-435 [单秀娟, 孙鹏飞, 金显仕, 等. 黄海典型断面渔业资源结构的季节变化. 水产学报, 2013, 37(3): 425-435] |
SU C C, SHAN X J, YANG T, et al. Interdecadal changes in keystone species of fish community during autumn in the Yellow Sea. Progress in Fishery Sciences, 2021, 42(6): 1-14 [苏程程, 单秀娟, 杨涛, 等. 黄海秋季鱼类群落关键种的年代际变化. 渔业科学进展, 2021, 42(6): 1-14] |
SU Y Q, ZHANG Y, JIA X R, et al. Application of several diversity indexes in forest community analysis. Ecological Science, 2017, 36(1): 132-138 [苏宇乔, 张毅, 贾小容, 等. 几种多样性指标在森林群落分析中的应用比较. 生态科学, 2017, 36(1): 132-138] |
SUN Z Q, ZHU Y P, ZHANG X Y, et al. Assessment of shrub and herb diversity ordering by Rényi diversity profiles for Kunyushan Forest Reserve. Journal of Nanjing Forestry University (Natural Science Edition), 2012, 36(1): 73-78 [孙志强, 朱彦鹏, 张星耀, 等. 采用Rényi多样性曲线法评价昆嵛山林下灌草层多样性排序效果. 南京林业大学学报(自然科学版), 2012, 36(1): 73-78] |
TSIKLIRAS A C, STERGIOU K I. Mean temperature of the catch increases quickly in the Mediterranean Sea. Marine Ecology Progress Series, 2014, 515: 281-284 |
UGLAND K I, GRAY J S, ELLINGSEN K E. The species- accumulation curve and estimation of species richness. Journal of Animal Ecology, 2003, 72(5): 888-897 |
WERNBERG T, SMALE D A, TUYA F, et al. An extreme climatic event alters marine ecosystem structure in a global biodiversity hotspot. Nature Climate Change, 2013, 3(1): 78-82 |
WICKHAM H. ggplot2: Elegant graphics for data analysis. New York: Springer-Verlag, 2016
|
WILHM J L. Use of biomass units in Shannon's formula. Ecology, 1968, 49(1): 153-156 |
WU Q, WANG J, LI Z Y, et al. Spatial variation of crustacean community structure in Yellow Sea and Bohai Sea in spring. Journal of Fisheries of China, 2012, 36(11): 1685-1693 [吴强, 王俊, 李忠义, 等. 黄渤海春季甲壳类群落结构的空间变化. 水产学报, 2012, 36(11): 1685-1693] |
WU Q, WANG J, LI Z Y, et al. The community structure and biodiversity of Cephalopoda in central and southern Yellow Sea. Marine Sciences, 2015(8): 16-23 [吴强, 王俊, 李忠义, 等. 黄海中南部头足类的群落结构与生物多样性. 海洋科学, 2015(8): 16-23] |
WU Q, YING Y P, TANG Q S. Changing states of the food resources in the Yellow Sea large marine ecosystem under multiple stressors. Deep Sea Research PartⅡ: Topical Studies in Oceanography, 2019, 163: 29-32 |


