2. 中国水产科学研究院黄海水产研究所 山东 青岛 266071
2. Yellow Sea Fisheries Research Institute, Chinese Academy of Fishery Sciences, Qingdao 266071, China
虾酱又称虾膏,是一种传统的水产发酵制品,滋味丰富、气味独特,在我国沿海和东南亚地区比较盛行(苑宁等, 2017)。虾酱的历史悠久,被列为省级非物质遗产保护名录。种类繁多,如南方港澳地区的虾膏、广东的幼滑虾酱,北方地区山东的蜢子虾酱、天津的北塘虾酱等都颇具盛名。虾酱传统生产工艺大多简单粗放,通常以毛虾、蜢子虾和麻虾等经济价值低的小型虾类为原料,在微生物及一系列内源酶作用下自然发酵而成(康宪等, 2013; 范智义等, 2020)。虾酱产品品质受多种因素的影响,如原料虾种类、虾新鲜度、发酵时间、发酵温度、盐添加量和贮藏时间等。如Yao等(2021)研究发现,分别以虾头、虾肉以及整虾为原料的北塘虾酱的微生物组成显著不同,导致其风味差异显著。Zhu等(2019)研究发现,贮藏2年的虾酱鲜味氨基酸含量最高,风味最佳等。
目前国内市场上的虾酱产品品种多样,品质有显著差异,而对市售虾酱产品品质进行系统评价的研究报道还很少。对同类型不同品牌的产品品质进行评价时,通常采用综合数据分析法,其中,主成分分析法(principal component analysis, PCA)是一种常用的多变量统计分析方法(陈胜军等, 2019; Pongsetkul et al, 2022),其通过正交转换对初始变量降维,用少数几个变量代替多个变量,并且可以最大限度保留原有的基础信息(张维等, 2021)。如侯钟令等(2020)基于主成分分析法建立了市售南极磷虾油品质分析模型,为产品品质等级评定提供了技术手段。
为进一步了解我国市售虾酱的品质概况,本研究收集了32种市售虾酱,进行了感官评定和主要的理化指标的测定,通过主成分分析法对产品进行了综合评价。在此基础上,对影响虾酱品质的关键因素——风味做了进一步分析。研究结果可以为虾酱产品的品质评价、标准化生产等提供参考。
1 材料与方法 1.1 实验材料与设备分别于山东、广东、河北、天津、辽宁和江苏采集虾酱产品32种,按照样品采集先后顺序依次编号,样品主要信息见表 2。NaOH、AgNO3、K2CrO4、无水硫酸铜、K3SO3、H3BO3、HCl、浓硫酸、CH2O等均为分析纯,购自国药化学试剂有限公司。
pH808型pH计(希玛SMART SENSOR仪表公司);LX0711型箱式高温电阻炉(天津市莱玻特瑞仪器有限公司);DHG-9140A型电热恒温鼓风干燥箱(上海精宏实验设备有限公司);IKA T18型高速分散机(IKA公司,德国);ME204型分析天平(0.1 mg,梅特勒托利多科技(中国)有限公司);K9840型凯氏定氮仪(济南海能仪器股份有限公司);PEN-3型电子鼻(Airsense公司,德国)。
1.2 实验方法 1.2.1 感官评价方法参照李丽华等(2014)的方法,由10位接受过感官评定培训的人员组成评定小组,根据表 1标准分别对32种虾酱产品进行感官评分,结果以平均值表示。
|
|
表 1 虾酱感官评价表 Tab.1 Sensory evaluation criteria for shrimp paste product |
参照李倩等(2022)的方法,略作修改。取0.5 g样品置于20 mL顶空瓶中,准备时间10 s,检测时间150 s,清洗时间100 s。电子鼻测试数据采用WinMuster软件进行分析。
1.2.3 气相色谱–离子迁移谱仪(GC-IMS)测定方法参考孟维一等(2021)的方法,略作修改。准确称取1.0 g虾酱,放入20 mL顶空进样瓶中,60 ℃平衡20 min后,通过自动顶空进样,用GC-IMS进行检测。通过比对NIST气相保留指数数据库与IMS迁移时间数据库对物质进行定性分析,采用设备自带LAV软件的Gallery Plot功能绘制样品中的挥发性物质图谱。
1.2.4 理化指标测定方法水分含量测定参照GB 5009.3—2016《食品安全国家标准食品中水分的测定》中的直接干燥法。
灰分含量测定参照GB 5009.4—2016《食品安全国家标准食品中灰分的测定》。
盐分含量测定参照SC/T 3011—2001《水产品中盐分的测定》中的直接滴定法。
氨基酸态氮含量测定参照GB 5009.235—2016《食品安全国家标准食品中氨基酸态氮的测定》中的酸度计法。
蛋白质含量测定参照GB 5009.5—2016《食品安全国家标准食品中蛋白质的测定》中的凯氏定氮法。
1.2.5 主成分分析方法参考刘惠惠等(2021)的方法,通过式(1)分别计算出每个样品的主成分得分,通过式(2)计算出样品的综合得分,以此作为综合排序依据。
| $ F = \sum\limits_j^n {\lambda j*{\text{ZX}}j} $ | (1) |
| $ {F}_{综合}=\frac{{i}_{1}}{{i}_{1}+{i}_{2}+{i}_{3}}*{F}_{1}+\frac{{i}_{2}}{{i}_{1}+{i}_{2}+{i}_{3}}*{F}_{2}+\frac{{i}_{3}}{{i}_{1}+{i}_{2}+{i}_{3}}*{F}_{3} $ | (2) |
式(1)中,F为主成分得分;λj为j指标特征向量;ZXj为标准化处理后的j指标数值;式(2)中,in为第n个主成分的特征值。
1.2.6 数据处理实验重复2次,每组样品做3个平行,使用Excel软件进行数据统计处理,利用SPSS 22.0软件进行主成分分析,采用Origin 2018绘制聚类热图。
2 结果与分析 2.1 感官评价结果从色泽、质地和气味3个方面对市售虾酱感官品质进行评价,结果如表 2所示。市售虾酱的色泽得分范围为1.8~4.5,平均得分为3.3,变异值为23.06%;质地得分范围为1.75~4.75,平均得分为3.36,变异值为22.99%;气味得分范围为0.3~4.0,平均得分仅为2.84,变异值达到37.64%,说明市售虾酱的色泽和质地整体差异相对较小,而不同品牌虾酱产品的气味存在很大差异,且气味总体接受程度较低。虾酱的气味与原料种类、原料新鲜度、发酵工艺等多种因素有关。发酵过程中,原料虾在嗜盐微生物作用下,蛋白质、碳水化合物和脂肪酸被分解,生成多种酮类、醛类和烷烃类化合物,从而增加虾酱的发酵香味(Lu et al, 2022),与此同时也会产生甲基硫化物、三甲胺等一些令人不愉悦的气味(Lü et al, 2020)。
|
|
表 2 市售虾酱感官评分与生化指标分析结果 Tab.2 Results of sensory score and biochemical index of shrimp paste products gathered from Chinese market |
虾酱样品的水分、灰分、盐分、氨基酸态氮和蛋白质含量检测结果见表 2。水分对应的变异系数最小,氨基酸态氮对应的变异系数最大,达到33.91%,表明氨基酸态氮是评定虾酱品质的重要指标。SC/T 3602-2016《虾酱》中规定,虾酱的水分含量应≤60%,灰分含量应≤35%,盐分含量应≤25%,蛋白质含量应≥10.0 g/100 g,氨基酸态氮含量应≥0.6 g/100 g。在采集的32种样品中,有7种样品的水分含量明显高于60%,可能与生产时缩短发酵周期有关(Handayani et al, 2021)。32种虾酱的灰分含量均≤35%,符合标准要求。50%的市售虾酱样品盐分含量大于20%,说明市售虾酱多为高盐发酵虾酱,高盐饮食可能会导致血压升高等一系列健康问题,降低传统虾酱中的盐分含量更符合现代消费者的消费理念(于慧等, 2017; Cai et al, 2017; Li et al, 2022)。28个样品的蛋白质含量符合要求,不合格率为12.5%。31个虾酱样品的氨基酸态氮含量符合标准要求,其中有78.13%的虾酱样品的氨基酸态氮含量大于1.0 g/100 g,少数虾酱甚至可以达到2.0 g/100 g以上,显著高于鱼露的氨基酸态氮含量(李文静等, 2022),与市售蚝油的氨基酸态氮含量相当(丁奇等, 2021)。氨基酸态氮与虾酱的鲜味密切相关,是影响产品品质的关键指标之一。
2.3 主成分分析结果对表 2数据进行KMO检验和巴利特球检验,KMO值为0.623,巴利特球检验的Sig<0.05,说明样本适用于主成分分析,且各个变量在一定程度上相互独立(马双等, 2020)。表 3为8个主成分的特征值、方差贡献率以及累计方差贡献率,根据主成分特征值大于1的原则,提取到3个主成分(PC1、PC2、PC3),其累计方差贡献率达到82.32%,说明这3个主成分可以基本涵盖虾酱品质的相关信息。
|
|
表 3 主成分的特征值、贡献率及指标权重 Tab.3 Eigenvalue, contribution rate and index weight of principal components |
主成分的载荷矩阵及其品质指标的载荷值如表 4所示,指标的载荷绝对值越大,表示指标对该主成分的贡献越大。综合主成分的方差贡献率分析可知,主成分1的方差贡献率为40.89%,水分、氨基酸态氮、蛋白质、质地在主成分1中起主要作用,其中水分和氨基酸态氮的载荷绝对值最大,是主成分1的主要贡献指标。主成分2的方差贡献率为26.14%,灰分、盐分、气味在主成分2中起主要作用,其中气味的载荷绝对值最大,是主成分2的主要贡献指标。主成分3的方差贡献率为15.29%,其中色泽的载荷值最大。根据各个变量在不同主成分中的载荷绝对值,水分、氨基酸态氮和气味是影响虾酱综合品质的主要指标。
|
|
表 4 主成分的载荷矩阵及其指标的特征向量 Tab.4 Load matrix of principal components and characteristic vector of its indicators |
构建各主成分得分与虾酱各品质指标之间的线性关系式,以及综合得分与各主成分得分之间的线性关系式,如下:
| $ F_{1}=–0.501ZX_{1}+0.377ZX_{2}+0.321ZX_{3}+0.425ZX_{4}+ \\ 0.376ZX_{5}–0.196ZX_{6}–0.354ZX_{7}+0.131ZX_{8}\text{;} $ |
| $ F_{2}=–0.059ZX_{1}+0.450ZX_{2}+0.451ZX_{3}–0.349ZX_{4}– \\ 0.391ZX_{5}+0.251ZX_{6}+0.174ZX_{7}+0.472ZX_{8}\text{;} $ |
| $ F_{3}=–0.211ZX_{1}–0.032ZX_{2}–0.271ZX_{3}+0.265ZX_{4}+ \\ 0.347ZX_{5}+0.686ZX_{6}+0.408ZX_{7}+0.231ZX_{8}\text{;} $ |
| $ F_{综合}=0.497F_{1}+0.318F_{2}+0.185F_{3} 。$ |
该模型可以为科学评价虾酱品质提供理论参考,也可为生产企业品控提供技术手段。
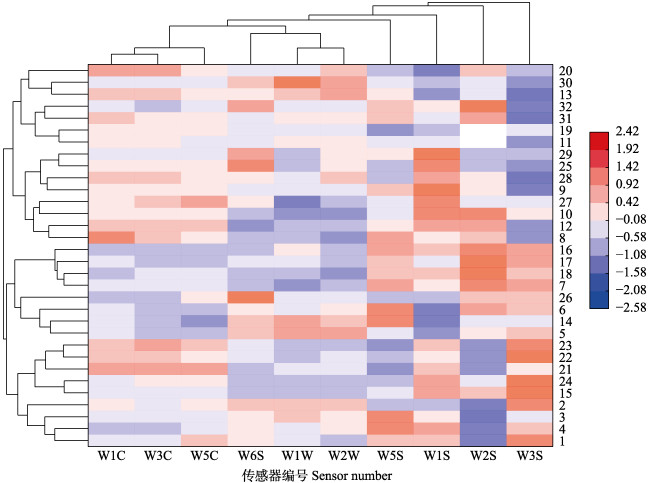
2.4 电子鼻分析结果气味是影响虾酱品质的关键因素之一。为进一步探究不同品种虾酱的气味组成差异,将电子鼻测定结果进行了聚类分析,结果见图 1。在欧氏距离4.03处将32种虾酱聚为4类,第1类(样品编号为1、4、3、2、15、24、21、22、23)的W3S传感器响应值较高,W3S传感器对烷烃类物质敏感,这类物质主要来自于虾中脂肪酸烷氧自由基的均裂(栾宏伟等, 2020),李莹等(2016)在传统锦州白虾酱中也检测到少量烷烃物质,且主要是长链脂肪烃类。第2类(样品编号为5、14、6、26、7、18、17、16)的W2S传感器响应值较高,说明其风味物质中包含的醇类物质含量较高,以海银虾为原料的虾酱都涵盖在此类中。第3类(样品编号为8、12、10、27、9、28、25、29)的W1S传感器响应值比较高,部分蜢子虾酱聚到此类中。第4类(样品编号为11、19、31、32、13、30、20)的W2W传感器响应值相对较高,而W1S、W3S传感器响应值较低,以毛虾为原料生产的虾酱产品很多聚到此类。由此,不同品种市售虾酱气味轮廓有明显差别,其中原料不同是造成这种差异的主要原因之一。

|
图 1 虾酱电子鼻聚类分析热图 Fig.1 Cluster heat map of shrimp paste by electronic nose W1C传感器对芳香物质灵敏;W3C传感器对芳香成分灵敏;W5C传感器对烷烃芳香成分灵敏;W6S传感器对氢气灵敏;W1W传感器对硫化物灵敏;W2W传感器对有机硫化物灵敏;W5S传感器对氮氧化合物灵敏;W1S传感器对甲烷灵敏;W2S传感器对乙醇灵敏;W3S传感器对烷烃灵敏。 W1C sensor is sensitive to aromatic substances; W3C sensor is sensitive to aromatic component; W5C sensor is sensitive to aromatic component of alkanes; W6S sensor is sensitive to hydrogen; W1W sensor is sensitive to sulfide; W2W sensor is sensitive to organic sulfide; W5S sensor is sensitive to nitrogen oxides; W1S sensor is sensitive to methane; W2S sensor is sensitive to ethanol; W3S sensor is sensitive to alkane. |
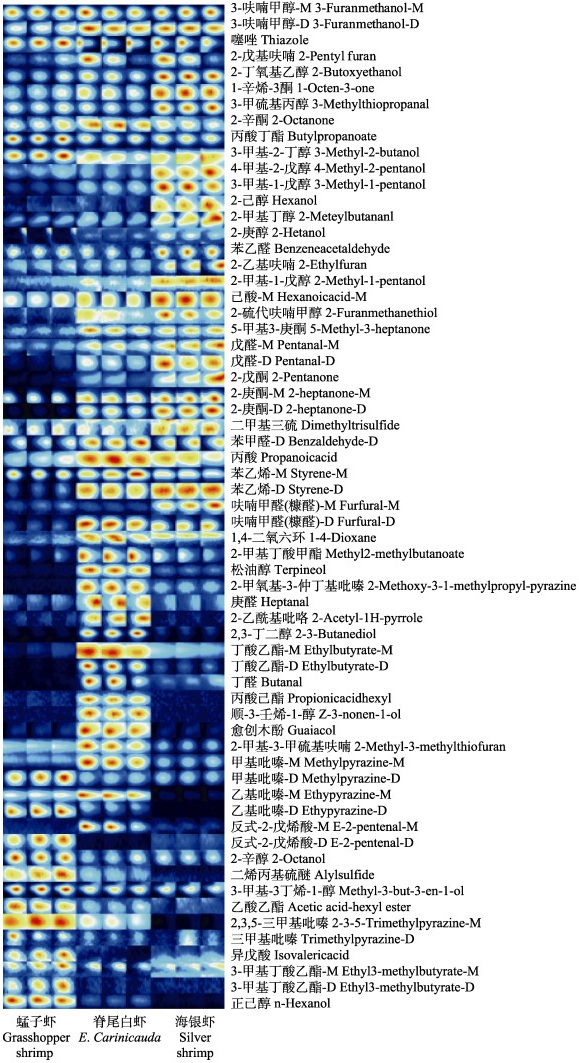
为进一步探究不同原料虾酱的气味差异,基于电子鼻分析的结果,选取3种原料虾(海银虾、白虾和蜢子虾)加工成的虾酱做进一步分析,结果见图 2。从3种虾酱共鉴定出63种挥发性物质,包括醇类18种、醛类8种、酯类8种、吡嗪类7种、酮类6种、酸类5种、烷烃类5种、呋喃类3种。其中,醇类物质含量较高,这与之前的多项研究结论一致,如赵洪雷等(2019)研究发现,醇类物质是虾酱中主要的挥发性成分,Li等(2023)在研究河北沧州虾酱时也得出类似的结果。

|
图 2 不同原料虾酱的Gallery Plot图谱 Fig.2 Gallery Plot map of shrimp paste with different ingredients |
海银虾酱和白虾酱中的挥发性物质主要包括醇类、醛类和酮类,如2-硫代呋喃甲醇、戊醛、5-甲基3-庚酮,且海银虾酱醇类物质较多,如3-甲基-2-丁醇、4-甲基-2-戊醇、3-甲基-1-戊醇,这与电子鼻分析结果一致。白虾酱中含有多种酯类化合物,如丁酸乙酯、丙酸己酯。蜢子虾酱中吡嗪类化合物和酯类化合物含量较高,如2, 3, 5-三甲基吡嗪、3-甲基丁酸乙酯。这些挥发性物质种类和含量的差异是造成不同原料虾酱风味差异的主要原因。
3 结论32种市售虾酱的色泽和组织形态差异较小,而气味差异明显。理化指标中,有7个样品的水分含量明显高于标准限量,占收集样品数量的20%,这可能主要与发酵周期缩短有关;NaCl质量分数 > 20%的高盐虾酱比例较高;氨基酸态氮含量差别大,变异系数达33.91%。通过主成分分析得出,氨基酸态氮、水分含量、气味是影响虾酱品质的主要因素,并建立了综合评价模型:
| $ F_{综合}=0.497F_{1}+0.318F_{2}+0.185F_{3}。$ |
电子鼻可将32种虾酱聚为4类,原料是影响聚类的主要因素。借助GC-IMS从虾酱产品中鉴定出63种挥发性成分,主要是醇类。下一步将结合气味贡献对特征性挥发性成分进行筛选,建立无损快速的虾酱品质评价方法。
CAI L, WANG Q, DONG Z, et al. Biochemical, nutritional, and sensory quality of the low salt fermented shrimp paste. Journal of Aquatic Food Product Technology, 2017, 26(6): 706-718 DOI:10.1080/10498850.2016.1276111 |
CHEN S J, LIU X J, YANG X Q, et al. Analysis of characteristic elements and establishment of principal component evaluation model of abalone from different habitats. Progress in Fishery Sciences, 2019, 40(2): 83-90 [陈胜军, 刘先进, 杨贤庆等. 不同产地鲍鱼特征元素分析与主成分评价模型的建立. 渔业科学进展, 2019, 40(2): 83-90] |
DING Q, MA L L, LANG S, et al. Analysisi and comparison amino acid nitrogen and total acid in different condiments. Analytical Instrumentation, 2021(3): 70-74 [丁奇, 马立利, 郎爽, 等. 不同调味品中氨基酸态氮、总酸含量的分析及比较研究. 分析仪器, 2021(3): 70-74] |
FAN Z Y, DENG W Q, LI H, et al. Reserach progress on the desalination of traditional fermented condiments. China Condiment, 2020, 45(7): 194-200 [范智义, 邓维琴, 李恒, 等. 传统发酵调味品低盐化的研究进展. 中国调味品, 2020, 45(7): 194-200 DOI:10.3969/j.issn.1000-9973.2020.07.044] |
HANDAYANI B R, ZAINURI, ARIYANA M D, et al. Quality profiles of the traditional shrimp paste of lombok. IOP Conference Series: Earth and Environmental Science, 2021, 913(1): 012033 DOI:10.1088/1755-1315/913/1/012033 |
HOU Z L, ZHU L L, ZHOU D Q, et al. Construction of quality analysis model of Antarctic ktill oil based on principal component analysis algorithm. Journal of Southern Agriculture, 2020, 51(9): 2227-2235 [侯钟令, 朱兰兰, 周德庆, 等. 基于主成分分析算法的市售南极磷虾油品质分析模型构建. 南方农业学报, 2020, 51(9): 2227-2235 DOI:10.3969/j.issn.2095-1191.2020.09.023] |
KANG X, DAI P, LIN J, et al. Reserach progress of production technology of shrime paste. China Brewing, 2013, 32(9): 21-23 [康宪, 戴萍, 林捷, 等. 传统虾酱生产技术的研究进展. 中国酿造, 2013, 32(9): 21-23] |
LI L H, ZHAO L, CAO R, et al. Effect of raw shrimp freshness on quality of shrimp paste. Storage and Process, 2014, 14(5): 31-35 [李丽华, 赵玲, 曹荣, 等. 原料虾新鲜度对虾酱品质的影响. 保鲜与加工, 2014, 14(5): 31-35] |
LI Q, XIA G L, CAO R, et al. Changes in the flavor of Apostichopus japonicus gonads during enzymatic hydrolysis. Progress in Fishery Sciences, 2022, 43(6): 239-248 [李倩, 夏光丽, 曹荣, 等. 仿刺参性腺酶解过程风味变化. 渔业科学进展, 2022, 43(6): 239-248] |
LI W J, LI C S, WANG Y Q, et al. Improvement effect of Halanaerobium fermentans YL9-2 on quality and flavor of fish sauce during fermentation. South China Fisheries Science, 2022, 18(2): 115-123 [李文静, 李春生, 王悦齐, 等. 发酵盐厌氧菌YL9-2对鱼露发酵过程中品质和风味的改善作用. 南方水产科学, 2022, 18(2): 115-123] |
LI W Y, MI S, LIU X C, et al. Variations in the physicochemical properties and bacterial community composition during fermentation of low-salt shrimp paste. Food Research International, 2022, 154: 111034 DOI:10.1016/j.foodres.2022.111034 |
LI Y, LÜ X R, MA H H, et al. Analysis of volatile compounds in traditional Jinzhou shrimp paste using HP-SPME/ GC-MS. Food Fermentation Industries, 2016, 42(9): 210-216 [李莹, 吕欣然, 马欢欢, 等. 应用顶空-固相微萃取结合气相色谱–质谱联用技术分析传统锦州虾酱中挥发性物质. 食品与发酵工业, 2016, 42(9): 210-216] |
LI Y, YUAN L, LIU H, et al. Analysis of the changes of volatile flavor compounds in a traditional Chinese shrimp paste during fermentation based on electronic nose, SPME-GC-MS and HS-GC-IMS. Food Science and Human Wellness, 2023, 12(1): 173-182 DOI:10.1016/j.fshw.2022.07.035 |
LIU H H, WU W G, LIAO L Y. Quality evaluation of instant rice sold in market. Journal of Food Science and Technology, 2021, 39(6): 133-143 [刘惠惠, 吴卫国, 廖卢艳. 市售挤压方便米饭品质评价. 食品科学技术学报, 2021, 39(6): 133-143] |
LUAN H W, ZHU W H, ZHU L W, et al. Effect of different fermentation time on the flavor of shrimp paste. Science and Technology of Food Industry, 2020, 41(12): 75–81, 87 [栾宏伟, 朱文慧, 祝伦伟, 等. 不同发酵时间对乌虾酱风味的影响. 食品工业科技, 2020, 41(12): 75–81, 87] |
LU K, LIU L, ZI J, et al. New insights from flavoromics on different heating methods of traditional fermented shrimp paste: The volatile components and metabolic pathways. LWT-Food Science and Technology, 2022, 168: 113880 DOI:10.1016/j.lwt.2022.113880 |
LÜ X, LI Y, CUI T, et al. Bacterial community succession and volatile compound changes during fermentation of shrimp paste from Chinese Jinzhou region. LWT-Food Science and Technology, 2020, 122: 108998 |
MA S, HAO S X, LI L H, et al. Volatile compound evaluation of six varieties of caviar by principal componets analysis. Food and Fermentation Industries, 2020, 46(11): 269-276 [马双, 郝淑贤, 李来好, 等. 基于主成分分析的六种鱼子酱挥发性成分评价. 食品与发酵工业, 2020, 46(11): 269-276] |
MENG W Y, GU J, XU Q Q, et al. Analysis of volatile flavor compounds in pork meat from different carcass locations and breeds by gas chromatography-ion mobility spectrometry. Food Science, 2021, 42(24): 206-212 [孟维一, 古瑾, 徐淇淇, 等. 顶空气相色谱–离子迁移谱分析不同部位和品种猪肉的挥发性风味化合物. 食品科学, 2021, 42(24): 206-212] |
PONGSETKUL J, BENJAKUL S, BOONCHUEN P. Changes in volatile compounds and quality characteristics of salted shrimp paste stored in different packaging containers. Fermentation, 2022, 8(2): 69 |
YAO Y, ZHOU X, HADIATULLAH H, et al. Determination of microbial diversities and aroma characteristics of Beitang shrimp paste. Food Chemistry, 2021, 344: 128695 |
YU H, LIU H M, WANG J, et al. Kinetic modeling of quality changes of low-salt shrimp sauce during fermentation. Food Science, 2017, 38(18): 17-21 [于慧, 刘海梅, 王静, 等. 低盐虾酱品质动力学模型的建立. 食品科学, 2017, 38(18): 17-21] |
YUAN N, ZHANG Y Z, JIA L N, et al. Study on the quality of shrimp paste. China Condiment, 2017, 42(8): 151-154 [苑宁, 张蕴哲, 贾丽娜, 等. 关于虾酱品质的研究. 中国调味品, 2017, 42(8): 151-154] |
ZHAO H L, YIN Y M, CHEN Y Y, et al. Flavor characteristics shrimp pastes from different regions and variance analysis. Food and Fermentation Industries, 2019, 45(10): 194-200 [赵洪雷, 尹一鸣, 陈义莹, 等. 不同产地虾酱风味特征及差异分析. 食品与发酵工业, 2019, 45(10): 194-200] |
ZHANG W, FU F H, LUO S N, et al. Quality analysis and evalution of Hunan red kiwifruit verieties. Food and Fermentation Industries, 2021, 47(5): 201-210 [张维, 付复华, 罗赛男, 等. 湖南红心猕猴桃品种品质评价及综合分析. 食品与发酵工业, 2021, 47(5): 201-210] |
ZHU W, LUAN H, BU Y, et al. Flavor characteristics of shrimp sauces with different fermentation and storage time. LWT-Food Science and Technology, 2019, 110: 142-151 |


