2. 山东省东营生态环境监测中心 山东 东营 257091;
3. 中国海洋大学 深海圈层与地球系统前沿科学中心和物理海洋学实验室 山东 青岛 266100
2. Monitoring Center of Ecology and Environment of Dongying, Dongying 257091, China;
3. Frontier Science Center for Deep Ocean Multispheres and Earth System and Physical Oceanography Laboratory, Ocean University of China, Qingdao 266100, China
氮、磷作为重要的限制性生源要素,对调控近海水环境的生物生产力和生态环境质量具有重要意义。大型河口承载着快速发展的人类活动,作为连接陆地与海洋的纽带,汇合大量含有氮、磷营养物质,发生剧烈变化后输入到近海环境,在提供生物初级生产的物质基础的同时,可能导致水域富营养化等环境效应。因此,营养盐的组成和时空分布一直是监控和评估河口区生态环境质量、预测其生物资源潜力的主要因素。
黄河是东亚大陆第二大河,入海于渤海湾与莱州湾交汇处;黄河每年携带大量的入海营养盐和有机物质,成为西太平洋西北陆架区的重要物质来源和生物生产力支撑。伴随着黄河三角洲的开发,海岸工农业和海洋养殖业迅速发展,黄河口的生态环境受到人类活动的显著影响,同时受径流和潮流的共同作用,形成独特的生态结构和复杂的生态环境,对于外界扰动较为敏感,对人类活动的反馈迅速。
黄河口海域溶解无机氮(DIN)浓度较高(殷鹏等, 2011; Liu et al, 2012),其中,2006年之前,DIN和活性磷酸盐(DIP)浓度总体呈上升趋势(纪大伟, 2006; 张继民等, 2008; 夏斌等, 2009)。渤海富营养化随之越来越严重,1997—2003年渤海发生赤潮的频率和面积迅速增加;2003年后发生赤潮的频率有所下降,但仍在10次左右,且赤潮面积增大到6 000 km2 (张志锋等, 2012; 于春艳等, 2013)。渤海生态环境和生物资源受到前所未有的威胁。为此,国务院批准实施了《渤海碧海行动计划》,国家管理部门制定了《渤海综合整治规划》、《渤海沿海资源管理行动计划》、《渤海环境管理战略》和《渤海综合治理攻坚战行动计划》等。2006年起,黄河口海域氨氮和DIN浓度迅速降低,DIN浓度由超过40 μmol/L降至20 μmol/L以下,2010—2017年维持较低水平(刘丽雪等, 2014; 胡琴等, 2016; 祝雅轩, 2019)。2018年起,黄河口邻近海域和莱州湾海域出现DIN超标现象,而一直被治理、减排的氨氮浓度未出现超标现象(姜磊, 2020; 李斌等, 2022; 梁生康等, 2022; 陆庆沅, 2022)。
河流“氮多、磷少”的特征,导致中国大部分河口氮/磷比(N/P)较高(郭金强等, 2020; 马奔等, 2021; 梁生康等, 2022)。2008—2009年黄河口水体平均N/P高达610.0 (Liu et al, 2012),虽然2018—2019年降至215,但是极高的N/P结构未改变(王一诺等, 2023),因此,黄河口海域一直处于潜在磷限制的营养状态(殷鹏等, 2011; Liu et al, 2012; 刘丽雪等, 2014; 胡琴等, 2016; 王丽莎等, 2021)。
随着近年来气候变化及营养盐输送和分布状况的变化,黄河口海域营养盐组成和结构的现状如何?引领了怎样的变化趋势?本文通过现状调查,研究黄河口海域营养盐的时空分布现状,分析近20年黄河口的营养盐组成和结构的变化规律,探讨现状下营养盐来源和分布的主控因素,为防控区域富营养化进程,靶向监控和减排氮、磷,精准施策莱州湾生态保护提供科学依据。
1 材料与方法 1.1 研究区域和样品采集调查海域位于黄河口海域,围绕黄河口湿地向北到达老黄河口邻近海域,向南到达莱州湾西部海域,设置35个站位;考虑黄河为海域主要物质来源,在河道下游接近口门的干流设置4个站位,记为H2∼H5;研究区域范围为37.5~38.9°N和118.4~119.6°E (图 1)。现场调查和样品采集开展于2023年5月和8月,分别代表北方海域2次初级生产高峰季节。水深小于20 m时采集表、底层水样,水深大于20 m时采集表、中、底3层水样。水样经0.7 μm GF/F (Whatman)滤膜过滤后,滤液冷冻保存用于溶解态营养盐分析。同步以CTD (RBRmaestro3, 加拿大)监测温度(T)、盐度(S)和pH。

|
图 1 黄河口邻近海域采样站位 Fig.1 Sampling stations in the ambient sea area of the Yellow River estuary |
化学需氧量(COD)采样和分析方法参照《海洋调查规范》(GB/T 12763.2-2007),以碱性高锰酸钾法测试。
溶解无机态硝酸盐(NO3–-N)、亚硝酸盐(NO2–-N)、氨氮(NH4+-N)、DIP、硅酸盐(SiO32–-Si)采用AA3营养盐自动分析仪测定,测定原理依次为镉铜还原法、重氮偶氮法、靛酚蓝法、磷钼蓝法和硅钼蓝法(Grasshoff et al, 2009),平行双样测试误差低于0.5%。DIN为NO3–-N、NO2–-N和NH4+-N之和。
叶绿素a (Chl a)水样经0.45 µm醋酸纤维滤膜过滤,加饱和MgCO3,滤膜经90%丙酮提取后,采用荧光光度法分析(GB17378.7-2007,F4600日立),分析误差低于3%。
1.3 统计分析使用SPSS 25.0软件整理分析数据,使用surfer 22软件绘制站位图和散点图,使用Origin 2023b绘制PCA图。
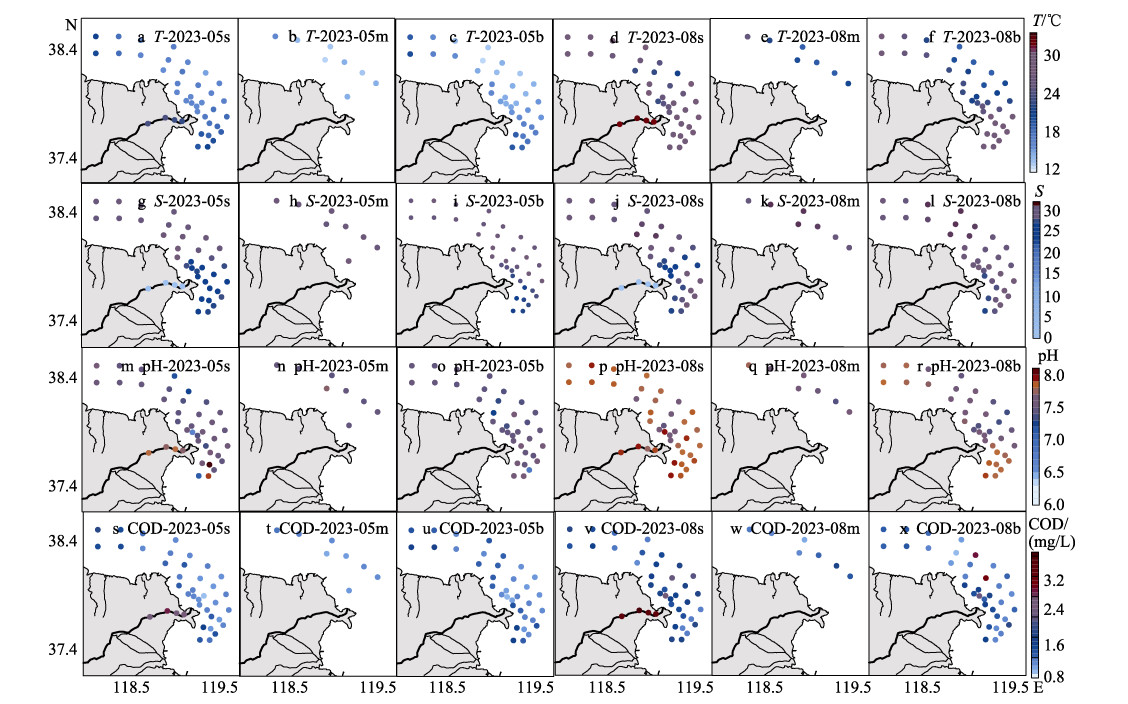
2 结果与讨论 2.1 主要理化因素的变化特征调查海域T、S、pH和COD分布如图 2所示。2023年5月和8月水温整体从表向底逐渐降低;8月平均水温比5月高8.6 ℃,T以河道下游最高,口门向北海域T相对较低,口门向南至莱州湾温度逐渐升高,黄河故道附近西部海域温度向西逐渐升高(见图 2a~f)。S以河道内最低,口门附近表层S相对较低,口门向南S逐渐升高;调查海域西北部S大于东南部,近岸和离岸海域底层S差别较大,离岸越远S越高(见图 2g~l)。8月pH平均值比5月高0.22;河道和莱州湾附近海域pH值相对较高,高值区主要出现在莱州湾附近(见图 2m~r)。8月COD平均值略高于5月;河道内COD较高,平均水平约为河口海域的2∼2.5倍(见图 2s~x)。
|
图 2 黄河口海域2023年5月和8月海水温度(T)、盐度(S)、pH和COD分布状况 Fig.2 Distribution of seawater temperature (T), salinity (S), pH, and COD in the Yellow River estuary and its adjacent waters in May and August 2023 图中s、m和b分别表示表、中和底层。下同。 s, m and b represent the surface, middle and bottom layers in the figures, respectively. The same below. |
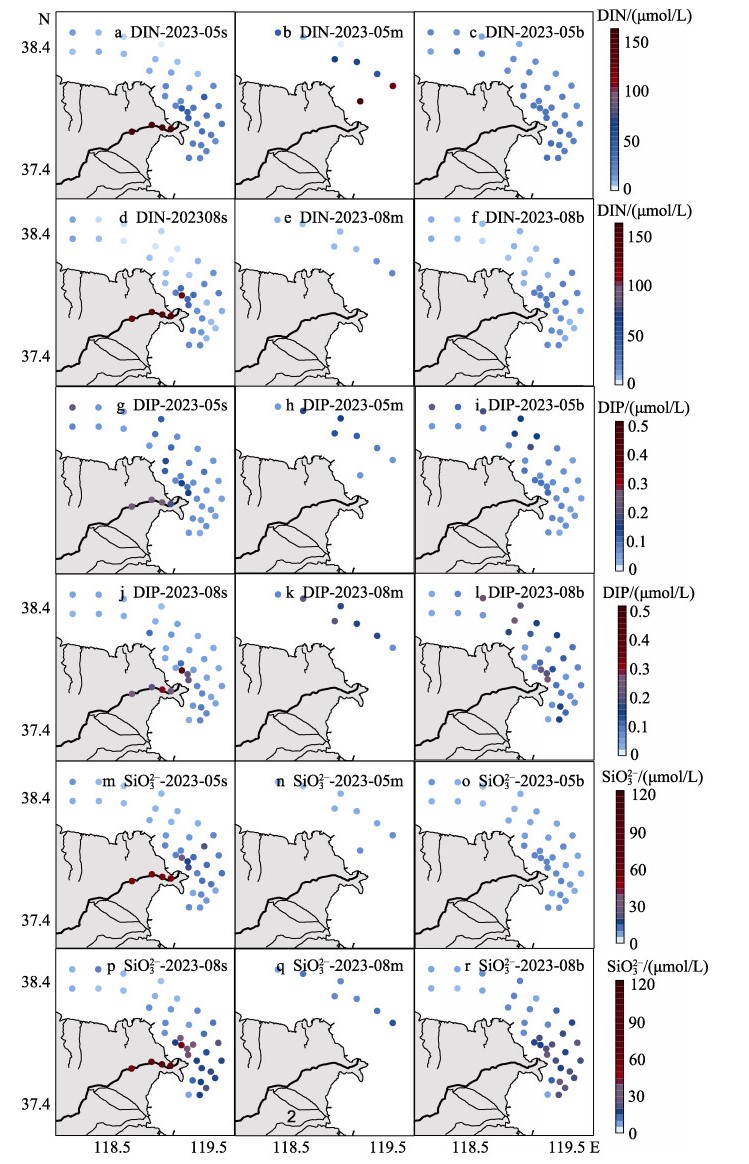
2023年5月调查海域表、中、底层DIN浓度如图 3a~c所示,整体以黄河口为中心,向西北和东南逐渐降低,高值区出现在黄河口及莱州湾附近海域,最小值出现在黄河口北部海域,其中,黄河口以南莱州湾附近海域DIN浓度高于黄河口以北海域。8月DIN浓度整体分布与5月相似(见图 3d~f)。虽然8月DIN平均浓度接近5月的1/2,但是变化范围更大,其最高值约为5月的2倍,最低值仅为5月的1/10左右。调查海域表、中、底层DIN分布基本一致,其中底层DIN浓度近岸高、离岸低的变化特征更为明显,中层5月和8月DIN浓度相差略小。在垂直方向上,表层DIN浓度最高,底层次之,中层浓度较低。本研究中,DIN的分布特征与前人的调查结果基本一致(张继民等, 2008; Liu et al, 2012; 胡琴等, 2016; 苏博等, 2021),与长江口和珠江口等大型河口相似(Ke et al, 2023; Yang et al, 2023),平均浓度远低于周边中、小型河口(王一诺等, 2023)。
|
图 3 黄河口海域2023年5月和8月溶解态营养盐的分布状况 Fig.3 Distribution of dissolved nutrients in the Yellow River estuary and its adjacent waters in May and August 2023 |
2023年5月调查海域表、中、底层DIP浓度高值区出现在黄河口北部和东部海域,近岸和离岸分布特征不明显(见图 3g~i)。8月DIP浓度总体高于5月;与DIN分布相似,DIP浓度较高值出现在黄河口外,并且大致呈现离岸越远浓度越低的特征(见图 3j~l)。与DIN不同的是,5月和8月DIP浓度平均水平相近,表、中、底浓度相差也较小。黄河下游河道水体中5月的DIN和DIP浓度约为黄河口门外的4倍和2倍,8月份约为10倍和4倍。
如图 3m~r所示,2023年8月SiO32–浓度总体水平高于5月(孙丕喜等, 2006; 郭富等, 2017)。与DIN和DIP相似,调查海域较高的SiO32–浓度分布在黄河口及莱州湾附近海域,黄河口东南部高于西北部。垂直分布上,表层浓度较高,底层次之,中层较低。
2.3 营养盐组成和结构特征 2.3.1 溶解无机氮的组成2023年5月和8月调查区域DIN都以NO3–-N为主要组份,占比为50.7%∼ 96.5% (平均为85.2%),NO2–-N占比不到3% (0.7%∼ 2.9%),其余为NH4+-N,占比为2.4%∼47.6% (平均为13.1%);8月NO3–-N占比3.9%∼99.1% (平均为57.1%),NH4+-N占比0.5%∼93.8% (平均为30.7%),NO2–-N占比0.2%∼48.0% (平均为12.2%)。虽然2023年5月和8月DIN组成一致,但是5月和8月DIN组成的百分比变化较大,并且8月DIN各组分间的百分比变化远大于5月。
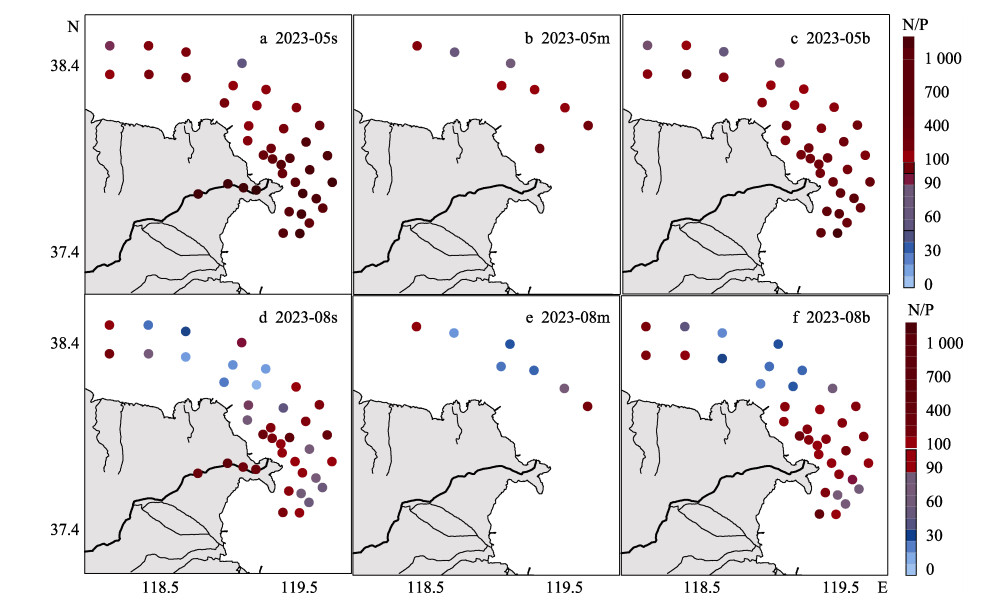
2.3.2 营养盐的结构特征DIN和DIP分别是氮、磷中活性较高的形态,其比值(N/P)多用来分析水环境营养盐结构(Redfield et al, 1963)。2023年5月调查海域表、中、底层N/P平均值分别为435.0、171.0和304.5,同期黄河下游河道的平均N/P为910.7(见图 4a~c),8月表、中、底层N/P平均值依次为136.4、76.0和137.8,同期黄河下游河道的平均N/P为410.9 (见图 4d~f)。调查海域5月N/P最低为43.7,8月各水层平均N/P降低了接近55%∼71%,并且有9%的水层N/P接近或低于Redfield ratio。调查海域表、中、底的N/P差别显著,表层较高,约是底层和中层的1.5和3倍;这一差异程度与DIN的垂直分布基本一致(见图 3)。在随时间变化和垂直分布上,N/P变化与DIN浓度变化表现出一致性(隋琪等, 2016),表明虽然黄河口海域DIN和DIP输送途径相近,但是二者输送量的变化不完全同步,DIN输送的变化程度相对于DIP更大。
|
图 4 黄河口海域2023年5月和8月海水溶解态无机氮/磷比值(N/P) Fig.4 Dissolved inorganic nitrogen/phosphorus ratio (N/P) of seawater in the Yellow River estuary and its adjacent waters in May and August 2023 |
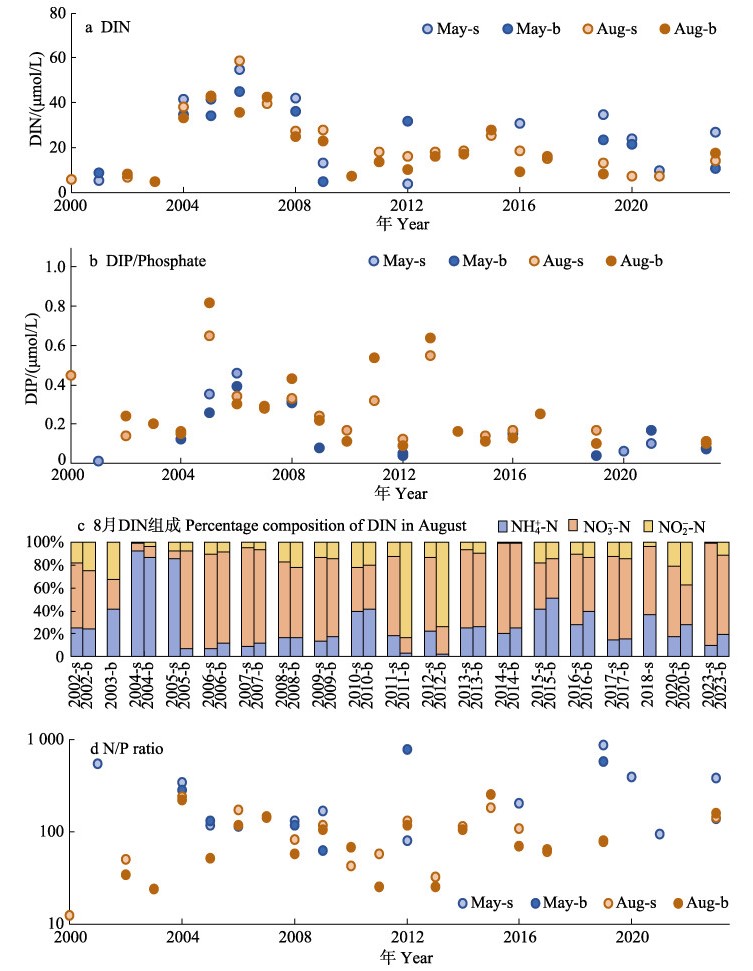
2002—2023年5月和8月黄河口海域DIN和DIP浓度、DIN组成和N/P的历史变化如图 5所示,其中,8月DIN浓度数据较为丰富。2002—2006年DIN浓度呈现增加的趋势,最高达到60 μmol/L左右(郭全, 2005; 纪大伟, 2006; 张继民等, 2008);2006年后DIN浓度逐渐降低(夏斌等, 2009; 殷鹏等, 2011; 刘义豪等, 2011),2010—2014年维持在较低水平(Liu et al, 2012; 刘丽雪等, 2014),除了2015年较高外(郭富等, 2015),直到2023年,DIN浓度持续较低(张欣泉等, 2020; Zhao et al, 2017; 张海波等, 2019; 祝雅轩, 2019; 由丽萍等, 2021; 梁生康等, 2022; 陆庆沅, 2022; 张晶晶等, 2022; 本研究)。2008年前,5月DIN的浓度变化与8月基本一致,除了2009和2021年明显低于8月DIN浓度外,至2023年,总体呈5月DIN浓度高于8月的现象,接近8月DIN平均浓度的2∼3倍。2004—2023年DIP浓度总体呈逐渐降低的趋势,除了个别年度,DIP浓度较低,历史变化与DIN不一致,这主要缘于二者从土壤中解吸及其与悬浮物作用的机制不同(Smith et al, 2003)。近20年,黄河口海域8月DIN组成百分比状况如图 5c所示。黄河口海域DIN总体以NO3–-N为主,其次为NH4+-N,再次为NO2–-N。尽管黄河高悬浮物可能加速还原态氮的氧化(Xia et al, 2004),但仍有NH4+-N或NO2–-N的浓度较高的现象。2004年,NH4+-N占比超过80%,同时,DIN浓度较高,表、底层相近,可能与高NH4+-N的陆源输送有关;在年径流量相近的情况下,同年8月,黄河径流量约为其他年份的2倍(http://www.yrcc.gov.cn/zwzc/gzgb/gb/nsgb/)。2011年表、底层和2012年底层NO2–-N超过80%,DIN浓度较低,可能与底层弱氧化环境有关。
|
图 5 黄河口海域溶解无机氮(DIN)、活性磷酸盐(DIP)浓度、DIN百分组成和氮/磷(N/P)的历史变化 Fig.5 Historical variations in dissolved inorganic nitrogen (DIN) and phosphate (DIP) concentrations, percentage composition of DIN, and nitrogen/phosphorus (N/P) in the Yellow River estuary and its adjacent waters |
根据近20年黄河口海域8月DIN和DIP平均浓度计算N/P,除了2000年,N/P远高于16,N/P超过100的时间和水层超过50%(见图 5d)。相比较而言,5月N/P高于8月,尤其自2016年以来,5月N/P远高于8月,且总体呈持续升高的趋势。不仅以长江、珠江为代表的大河河口(Ke et al, 2023; Yang et al, 2023; 孙策策等, 2023),而且与黄河邻近的辽河、小清河等中、小型河口(易柏林等, 2013; 王一诺等, 2023)同样表现为高N/P特征。比较同期调查结果,黄河下游干流N/P约是黄河口门附近海域N/P的2∼3倍(见图 4)。黄河口“氮多、磷少”的特征,使得以接受黄河输送为主要物质来源的莱州湾海域浮游植物生长受到显著的磷限制(邹立等, 2001; 由丽萍等, 2021),甲藻在浮游植物群落中比例增加(孙军等, 2002; 郭术津等, 2014),浮游植物群落由硅藻向甲藻或其他非硅藻群落演替,促动有害藻华的发生(Riegman et al, 1996; Egge, 1998; Ning et al, 2010; Li et al, 2014)。从黄河口海域营养盐组成和结构的发展趋势来看,“氮多、磷少”的不平衡状况可能会进一步加剧(Liu et al, 2009)。
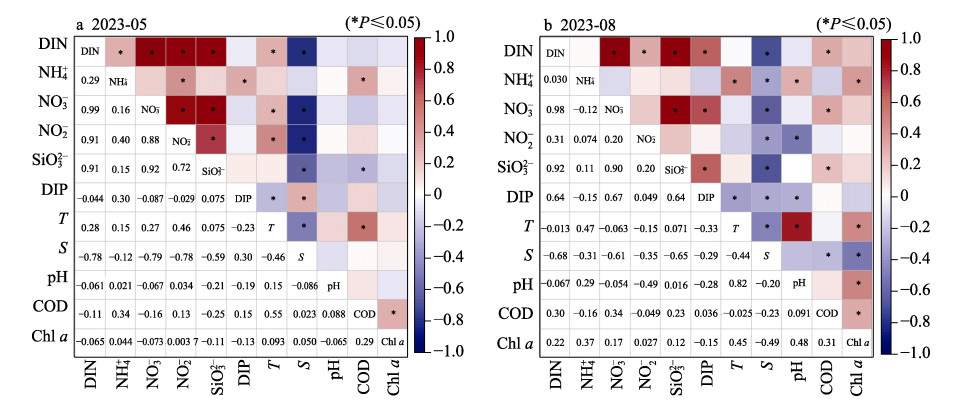
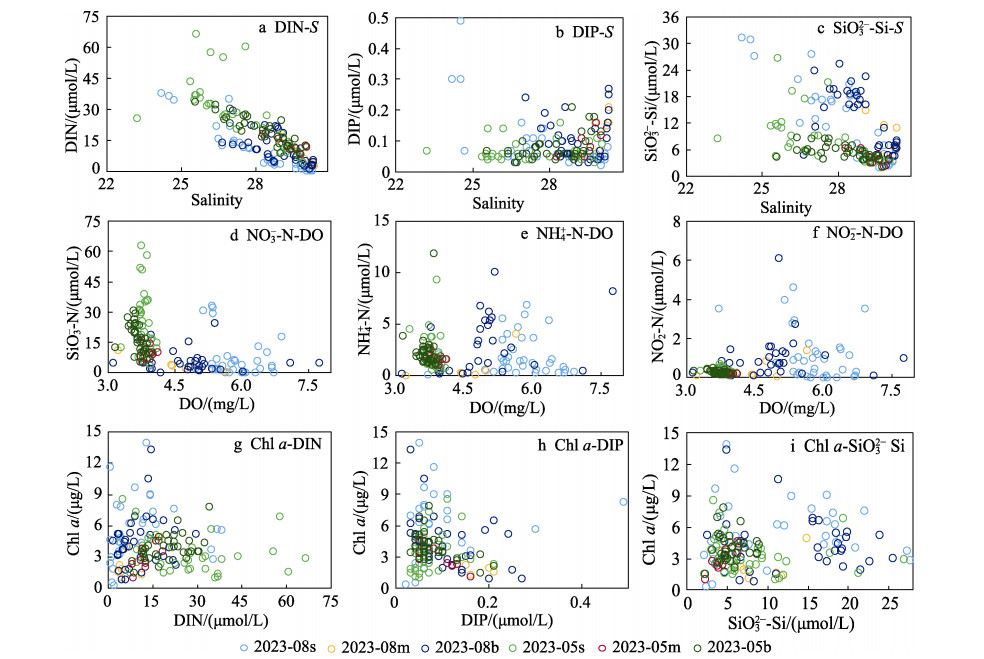
2.5 黄河口海域营养盐的输送途径和转化浅析黄河口海域营养盐来源和分布与人类活动关系密切,通过地表和地下多种途径由河入海。营养盐与主要理化要素的线性回归分析结果如图 6所示,2023年5月和8月,DIN浓度与S呈现显著负相关关系,二者变化过程相近(见图 7a);5月和8月,DIP浓度与S的相关关系呈现相反趋势;5月和8月,活性硅酸盐与S呈显著负相关关系,二者变化过程有一定差别(见图 7c),8月回归曲线的斜率是5月的3.4倍。黄河入海前干流DIN、DIP和活性硅酸盐平均浓度分别是黄河口海域平均浓度的16.9、3.5和8.2倍(本研究),DIN和活性硅酸盐与S的显著线性负相关关系表明,黄河径流是DIN、DIP和活性硅酸盐的主要来源。其中DIP与S显著相关比DIN与S小,并且5月和8月分别呈现正相关和负相关关系,可能与黄河下游和黄河口相对低的浓度被及时消耗的限制状况有关。地下水或沉积环境可能是调查海域营养盐的输送途径(Mao et al, 2008; Wang et al, 2011; Liu et al, 2012),本研究营养盐时空分布(见图 3)及其与盐度的关系(见图 6~7)未支持明确的地下水输送。
|
图 6 黄河口海域营养盐和主要理化因子的相关分析 Fig.6 Correlation analysis on the nutrients and primary physical and chemical factors in the Yellow River estuary and its adjacent waters |
|
图 7 黄河口海域营养盐浓度与盐度(S)、溶解氧(DO)和叶绿素a (Chl a)的离散点图 Fig.7 Discrete point plot of nutrient concentration and salinity (S), dissolved oxygen (DO), and chlorophyll a (Chl a) in the Yellow River estuary and its adjacent waters |
在河口复杂环境下,DIN组分由河入海过程中发生形态改变。DIN组分与DO的离散点图都呈分簇分布(见图 7d~f),表明DIN组分与DO受到共同因素的影响,二者间的直接相互作用较小或者很快达到平衡状态。溶解态有机氮(DON)在细菌作用下会先转化为NH4+,最后转化为NO3–和NO2–,因此,DON可能是DIN的源(罗延馨等, 1999)。2008—2009年黄河口海域DON和溶解态有机磷(DOP)分别约占溶解总氮的7%∼14%和溶解总磷的27%∼34% (Liu et al, 2012)。2019年5月和8月黄河下游的DON/DIN分别为1.4和2.7,DOP/DIP分别为6.3和1.8 (王一诺等, 2023)。可见在一定季节,DON、DOP转化可能成为DIN和DIP的重要来源。本研究结果表明,8月DIN平均浓度约为5月的1/2,Chl a平均浓度约为5月的2倍(见图 3、7g),因此,DON向DIN的转化对海域浮游植物初级生产更为重要;COD表征水环境中还原性物质的量,海域中溶解有机物是主要还原性物质,图 6显示,8月COD与DIN呈显著相关关系,可能与DON的转化相关;在环莱州湾河口的不同形态营养盐时空分布研究中,DON与DIN的相对占比具有显著的季节差异(王一诺等, 2023)。DON、DOP的转化及其潜在的生态学效应将是下一步关注探讨的问题。
营养盐参与浮游植物的初级生产活动而呈现非保守行为(邹立等, 2001; Ning et al, 2010)。DIN和DIP与Chl a的离散点图(见图 7g)显示,当DIN、DIP和Chl a处于较低浓度时,Chl a随DIN和DIP浓度增加而升高,此时,DIN或DIP为浮游植物初级生产的主要影响因素。当DIN和DIP浓度较高时,Chl a与之未呈现正相关关系,此时DIN和DIP充足,未起到限制性作用。相关分析结果表明,仅8月氨氮与Chl a呈现显著正相关关系(图 6),说明黄河口海域初级生产活动总体受营养盐限制不明显(王丽莎等, 2021),同时,浮游植物的初级生产活动不是营养盐时空分布的显著影响因素。
综上所述,黄河径流是研究区域营养盐的主要来源和时空分布的主要影响因素,溶解有机物转化和初级生产对营养盐的贡献程度和机制需要进一步研究和考证。
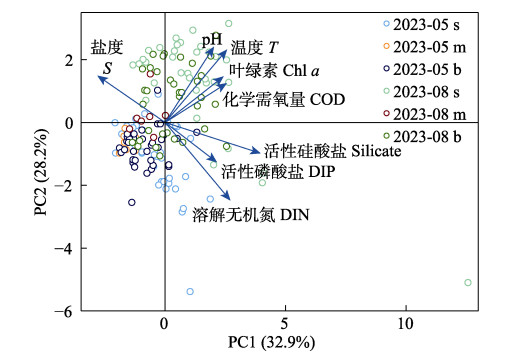
通过主成分分析,以理化性质、营养盐组成和Chl a等参数共同表征调查海域水质特征,结果如图 8所示。第1和第2主成分累积贡献率达到61.2%,前6个主成分累积贡献率为95.8%,说明主成分分析结果能够反映黄河口海域水质主要特征。分析结果表明,DIN和活性硅酸盐与T、S和pH均是表征水质特征的主要要素,其次为COD、Chl a和DIP。其中,5月的营养盐特征更强,8月的T和S等理化特征和Chl a特征更强。此外,无论5月还是8月,中层水质特征与底层更为接近,特征表现相对集中;同期的表层水质特征变化较大,5月水质特征向第四象限延伸,部分站位的营养盐变化特征更为明显,8月水质特征向第一象限延伸,T和pH及Chl a特征更明显。
|
图 8 黄河口及其邻近海域水质特征的主成分分析 Fig.8 Principal component analysis of water characteristics in the Yellow River estuary and its adjacent waters |
黄河口海域营养盐分布和历史变化如下:黄河口营养盐浓度分布总体由口门外分别向北和向东西降低,但是营养盐组成和结构的时空分布差异显著。黄河口营养盐平均浓度无明显升高,但其组成和分布不均匀,可能出现区域性和短时间超标现象。黄河口N/P呈现持续升高趋势,持续的“高氮、少磷”将进一步促使海域浮游植物群落由硅藻向甲藻或非硅藻的演替,增加有害藻华风险。黄河径流是主要的营养盐来源;未发现显著的地下水输送影响,浮游植物的初级生产活动总体对营养盐时空分布影响较小,而溶解有机态氮、磷的迁移转化可能成为营养盐的组成和结构演化的重要影响因素。营养盐与T、S和pH同样是表征黄河口水质特征的主要要素,其中,季节变化为水质特征改变的首要因素。
EGGE J K. Are diatoms poor competitors at low phosphate concentrations?. Journal of Marine Systems, 1998, 16(3/4): 191-198 |
GRASSHOFF K, KREMLING K, EHRHARDT M. Methods of seawater analysis. 3rd completely revised and enlarged edition. United States: Wiley, 2009: 159–228
|
GUO F, WANG B D, XIN M, et al. Nutrient distributions in the Laizhou Bay in spring and summer of 2015. Advances in Marine Science, 2017, 35(2): 258-266 [郭富, 王保栋, 辛明, 等. 2015年春、夏季莱州湾营养盐分布特征. 海洋科学进展, 2017, 35(2): 258-266 DOI:10.3969/j.issn.1671-6647.2017.02.010] |
GUO J Q, ZHANG G C, CHU C Y, et al. The input of nutrients through the Yangtze River and its effect on nutrient concentrations and structures of the Yangtze estuary. Marine Environmental Science, 2020, 39(1): 59–65, 74 [郭金强, 张桂成, 褚春莹, 等. 长江水体营养盐输入及对长江口海域营养盐浓度和结构的影响. 海洋环境科学, 2020, 39(1): 59–65, 74] |
GUO Q. Features in distributions of nutrients and chlorophyll and eutrophication assessment in the Bohai Sea in summer. Master´s Thesis of Ocean University of China, 2005 [郭全. 渤海夏季营养盐和叶绿素分布特征及富营养化状况分析. 中国海洋大学硕士研究生学位论文, 2005]
|
GUO S J, LI Y Q, ZHANG C X, et al. Phytoplankton community in the Bohai sea and its relationship with environmental factors. Marine Science Bulletin, 2014, 33(1): 95-105 [郭术津, 李彦翘, 张翠霞, 等. 渤海浮游植物群落结构及与环境因子的相关性分析. 海洋通报, 2014, 33(1): 95-105] |
HU Q, QU L, HUANG B G, et al. Status and evaluation on nutrients for the adjacent sea water of the Yellow River estuary in autumn of 2014. Marine Environmental Science, 2016, 35(5): 732-738 [胡琴, 曲亮, 黄必桂, 等. 2014年秋季黄河口附近海域营养现状与评价. 海洋环境科学, 2016, 35(5): 732-738] |
JI D W. Study on the Yellow River estuary environment status and its influencing factors. Master´s Thesis of Ocean University of China, 2006 [纪大伟. 黄河口及邻近海域生态环境状况与影响因素研究. 中国海洋大学硕士研究生学位论文, 2006]
|
JIANG L. Investigation on the ecological environment in the coastal waters of the Yellow River Delta and analysis of its changing trend. Master´s Thesis of University of Jinan, 2020 [姜磊. 黄河三角洲近岸海域生态环境调查及变化趋势分析. 济南大学硕士研究生学位论文, 2020]
|
KE S, CAI Z M, ZHANG P, et al. Effects of river input flux on spatiotemporal patterns of total nitrogen and phosphorus in the Pearl River estuary, China. Frontiers in Marine Science, 2023, 10: 1-16 |
LI B, YI Q W, LIU Z D, et al. Distribution characteristics of nutrients and eutrophication and organic pollution evaluation in the coastal area of Shandong. Environmental Science Survey, 2022, 41(6): 87-92 [李斌, 衣秋蔚, 刘增东, 等. 山东近岸海域营养盐分布特征及富营养化和有机污染评价. 环境科学导刊, 2022, 41(6): 87-92] |
LI H M, TANG H J, SHI X Y, et al. Increased nutrient loads from the Changjiang (Yangtze) River have led to increased harmful algal blooms. Harmful Algae, 2014, 39: 92-101 DOI:10.1016/j.hal.2014.07.002 |
LIANG S K, LI S S, MA H Y, et al. Spatial-temporal distributions and limiting factors of nutrients in Laizhou Bay based on land-sea synchronus survey. Periodical of Ocean University of China, 2022, 52(8): 97-110 [梁生康, 李姗姗, 马浩阳, 等. 基于陆海同步调查的莱州湾营养盐时空分布及限制因子分析. 中国海洋大学学报(自然科学版), 2022, 52(8): 97-110] |
LIU L X, WANG Y J, DI B P, et al. Spatial distribution of chlorophyll a and environmental factors in the Bohai Sea in spring of 2012. Marine Sciences, 2014, 38(12): 8-15 [刘丽雪, 王玉珏, 邸宝平, 等. 2012年春季渤海中部及邻近海域叶绿素a与环境因子的分布特征. 海洋科学, 2014, 38(12): 8-15 DOI:10.11759/hykx20140123002] |
LIU S M, HONG G H, ZHANG J, et al. Nutrient budgets for large Chinese estuaries. Biogeosciences, 2009, 6(10): 2245-2263 DOI:10.5194/bg-6-2245-2009 |
LIU S M, LI L W, ZHANG G L et al. Impacts of human activities on nutrient transports in the Huanghe (Yellow River) estuary. Journal of Hydrology, 2012, 430/431: 103-110 DOI:10.1016/j.jhydrol.2012.02.005 |
LIU Y H, YANG X L, JIN Y, et al. Distribution and inter-annual variation of nutrients in Laizhou Bay. Progress in Fishery Sciences, 2011, 32(4): 1-5 [刘义豪, 杨秀兰, 靳洋, 等. 莱州湾海域营养盐现状及年际变化规律. 渔业科学进展, 2011, 32(4): 1-5 DOI:10.3969/j.issn.1000-7075.2011.04.001] |
LU Q Y. Study on the fluxes and temporal and spatial evolution characteristics of major chemical pollutants in Laizhou Bay based on sea-land collaborative survey. Master´s Thesis of Shanghai Ocean University, 2022 [陆庆沅. 基于海陆协同调查的莱州湾主要化学污染物入海通量和时空演变特征研究. 上海海洋大学硕士研究生学位论文, 2022]
|
LUO Y X, SONG J M. Progress in studies on marine bio geochemical process on biogenic elements. Studia Marina Sinica, 1999(41): 65-78 [罗延馨, 宋金明. 生源要素的海洋生物地球化学过程研究进展. 海洋科学集刊, 1999(41): 65-78] |
MA B, ZHAO H. Distribution characteristics of chlorophyll a and nutrients in the Pearl River estuary in summer and their relationship with environmental factors. Marine Environmental Science, 2021, 40(5): 707-716 [马奔, 赵辉. 夏季珠江口叶绿素a和营养盐分布特征及其与环境因子的关系. 海洋环境科学, 2021, 40(5): 707-716] |
MAO X Y, JIANG W S, ZHAO P, et al. A 3-D numerical study of salinity variations in the Bohai Sea during the recent years. Continental Shelf Research, 2008, 28(19): 2689-2699 DOI:10.1016/j.csr.2008.09.004 |
NING X R, LIN C L, SU J L, et al. Long-term environmental change and the responses of the ecosystems in the Bohai Sea during 1960–1996. Deep Sea Research Part Ⅱ: Topical Studies in Oceanography, 2010, 57(11/12): 1079-1091 |
REDFIELD A C, KETCHUM B H, RICHARDS F A. The influence of organisms on the composition of sea-water. The Sea, 1963, 2: 26-77 |
RIEGMAN R, DE BOER M K, DE SENERPONT DOMIS L N. Growth of harmful marine algae in multispecies cultures. Journal of Plankton Research, 1996, 18(10): 1851-1866 DOI:10.1093/plankt/18.10.1851 |
SMITH S V, SWANEY D P, TALAUE-MCMAMNS L, et al. Humans, hydrology, and the distribution of inorganic nutrient loading to the ocean. Bioscience, 2003, 53(3): 235-245 DOI:10.1641/0006-3568(2003)053[0235:HHATDO]2.0.CO;2 |
SU B, ZHAO Y T, MA Y Q, et al. Distribution and structure of dissolved inorganic nitrogen and phosphorus in Laizhou Bay, 2018. Marine Environmental Science, 2021, 40(4): 535-541 [苏博, 赵玉庭, 马元庆, 等. 2018年莱州湾无机氮、磷平面分布及其结构特征. 海洋环境科学, 2021, 40(4): 535-541] |
SUI Q, XIA B, XIE H B, et al. Study on temporal and spatial variation of nutrients and evaluation on eutrophication in the seawater of the Bohai Sea in winter and spring of 2014. Progress in Fishery Sciences, 2016, 37(2): 10-15 [隋琪, 夏斌, 谢寒冰, 等. 2014年春季和冬季渤海海水营养盐时空变化特征及富营养化评价. 渔业科学进展, 2016, 37(2): 10-15] |
SUN C C, WU W T, LIU J, et al. Contribution of freshwater aquaculture for nitrogen and phosphorus production in the Changjiang River and its impact on estuarine environment. Progress in Fishery Sciences, 2023, 44(1): 35-46 [孙策策, 吴文涛, 刘军, 等. 淡水养殖对长江氮磷输出的贡献及其河口环境效应. 渔业科学进展, 2023, 44(1): 35-46] |
SUN J, LIU D Y, YANG S M, et al. The preliminary study on phytoplankton community structure in the central Bohai Sea and the Bohai Strait and its adjacent area. Oceanologia et Limnologia Sinica, 2002, 33(5): 461-471 [孙军, 刘东艳, 杨世民, 等. 渤海中部和渤海海峡及邻近海域浮游植物群落结构的初步研究. 海洋与湖沼, 2002, 33(5): 461-471] |
SUN P X, WANG B, ZHANG C H, et al. Relationship between nutrient distributions and eutrophication in seawater of the Laizhou Bay. Advances in Marine Science, 2006(3): 329-335 [孙丕喜, 王波, 张朝晖, 等. 莱州湾海水中营养盐分布与富营养化的关系. 海洋科学进展, 2006(3): 329-335] |
WANG L S, WEI X H, ZHANG H B, et al. Comparative study on the influence factors of chlorophyll-a and nutrient structure between winter and summer in the central Bohai Sea. Marine Fisheries, 2021, 43(4): 473-484 [王丽莎, 魏西会, 张海波, 等. 渤海中部冬夏季叶绿素a和营养盐结构影响因素对比分析. 海洋渔业, 2021, 43(4): 473-484] |
WANG Y C, LIU Z, GAO H W, et al. Response of salinity distribution around the Yellow River mouth to abrupt changes in river discharge. Continental Shelf Research, 2011, 31(6): 685-694 |
WANG Y N, GUANG W C, ZOU L, et al. Composition and transport of nitrogen and phosphorus in the main estuaries around Laizhou Bay. Marine Environmental Science, 2023, 42(5): 684-692 [王一诺, 关纬城, 邹立, 等. 环莱州湾主要河口氮磷组成特征及其输送贡献. 海洋环境科学, 2023, 42(5): 684-692] |
XIA B, ZHANG X L, CUI Y, et al. Evaluation of the physicochemical environment and nutrition status in Laizhou Bay and adjacent waters in summer. Progress in Fishery Sciences, 2009, 30(3): 103-111 [夏斌, 张晓理, 崔毅, 等. 夏季莱州湾及附近水域理化环境及营养现状评价. 渔业科学进展, 2009, 30(3): 103-111] |
XIA X H, YANG Z F, HUANG G H, et al. Nitrification in natural waters with high suspended-solid content-A study for the Yellow River. Chemosphere, 2004, 57(8): 1017-1029 |
YANG L, ZHANG Y J, WANG X L, et al. Spatiotemporal changes of biogenic elements in the Changjiang River estuary and adjacent waters in summer over the last decade. Acta Oceanologica Sinica, 2023, 42(1): 83-90 |
YI B L, ZOU L, WEN M, et al. Comprehensive evaluation on the aquatic environment in the Shuangtaizi estuary. Periodical of Ocean University of China (Natural Science), 2013, 43(11): 87-93 [易柏林, 邹立, 文梅, 等. 双台子河口水环境质量综合评价. 中国海洋大学学报(自然科学版), 2013, 43(11): 87-93] |
YIN P, LIU Z Y, ZHANG L J. Evaluation of the nutrition status for the adjacent waters of the Yellow River estuary. Transactions of Oceanology and Limnology, 2011(2): 120-130 [殷鹏, 刘志媛, 张龙军. 2009年春季黄河口附近海域营养状况评价. 海洋湖沼通报, 2011(2): 120-130] |
YOU L P, ZHAO Y T, SUN S, et al. Characteristics of nutrient structures and limitations in Laizhou Bay in the spring and summer of 2018. Progress in Fishery Sciences, 2021, 42(6): 15-24 [由丽萍, 赵玉庭, 孙珊, 等. 2018年春季和夏季莱州湾营养盐结构及限制特征. 渔业科学进展, 2021, 42(6): 15-24] |
YU C Y, LIANG B, BAO C G, et al. Study on eutrophication status and trend in Bohai Sea. Marine Environmental Science, 2013, 32(2): 175-177 [于春艳, 梁斌, 鲍晨光, 等. 渤海富营养化现状及趋势研究. 海洋环境科学, 2013, 32(2): 175-177] |
ZHANG H B, WANG L S, SHI X Y, et al. Spatial distributions and seasonal variations of nutrients and statistical analysis of nutrient limitation in the center of the Bohai Sea, China. China Environmental Science, 2019, 39(4): 1579-1588 [张海波, 王丽莎, 石晓勇, 等. 渤海中部营养盐季节变化及限制统计分析. 中国环境科学, 2019, 39(4): 1579-1588] |
ZHANG J J, WANG Y J, LI F, et al. Effects of pollution control of Xiaoqing River on environment factors and phytoplankton community in the Laizhou Bay. Environmental Science, 2022, 43(4): 1997-2006 [张晶晶, 王玉珏, 李凡, 等. 小清河专项治理对莱州湾环境和浮游植物的影响. 环境科学, 2022, 43(4): 1997-2006] |
ZHANG J M, LIU S, ZHANG Q, et al. Nutrient distribution and eutrophication assessment for the adjacent waters of the Yellow River estuary. Marine Science Bulletin, 2008, 27(5): 65-72 [张继民, 刘霜, 张琦, 等. 黄河口附近海域营养盐特征及富营养化程度评价. 海洋通报, 2008, 27(5): 65-72] |
ZHANG X Q, JIAG H C, MA Y Q, et al. The spatial distribution of environmental factors and the response of net- phytoplankton in the Laizhou bay during wet-season in 2017. Marine Environmental Science, 2020, 39(4): 614–621, 629 [张欣泉, 姜会超, 马元庆, 等. 2017年丰水期莱州湾环境因子分布特征及网采浮游植物的响应. 海洋环境科学, 2020, 39(4): 614–621, 629] |
ZHANG Z F, HE X, ZHANG Z, et al. Eutrophication status, mechanism and its coupling effect with algae blooming in Bohai. Marine Environmental Science, 2012, 31(4): 465–468, 483 [张志锋, 贺欣, 张哲, 等. 渤海富营养化现状、机制及其与赤潮的时空耦合性. 海洋环境科学, 2012, 31(4): 465–468, 483] |
ZHAO H D, KAO S J, ZHAI W D, et al. Effects of stratification, organic matter remineralization and bathymetry on summertime oxygen distribution in the Bohai Sea, China. Continental Shelf Research, 2017, 134: 15-25 |
ZHU Y X. Nutrient characteristics of Laizhou Bay and Liaodong Bay and their effects on ecological environment: a comparative study. Master´s Thesis of China University of Geosciences (Beijing), 2019 [祝雅轩. 莱州湾与辽东湾营养盐特征及其对生态环境的影响: 对比研究. 中国地质大学(北京)硕士研究生学位论文, 2019]
|
ZOU L, ZHANG J. Experimental study on the nutrient limitation in the spring of Bohai Sea. Oceanologia et Limnologia Sinica, 2001, 32(6): 672-678 [邹立, 张经. 渤海春季营养盐限制的现场实验. 海洋与湖沼, 2001, 32(6): 672-678] |


