中华绒螯蟹(Eriocheir sinensis)俗称河蟹、大闸蟹等,在我国东至鸭绿江口、西达湖北沙市、北起辽河、南至珠江的河流及其入海河口、浅海广泛分布,其中,以长江水系产量最大,口感最鲜美,深受国内消费者青睐,是我国渔业增养殖的重要对象(陈立侨等, 2017)。自20世纪80年代开展人工繁育和养殖以来,中华绒螯蟹产量猛增,成为全球主要经济蟹类之一,也是中国最重要的淡水经济蟹类。2020―2022年全国养殖产量分别达77.59万t、80.83万t和81.53万t,从养殖区域来看,长江流域约占全国总产量的八成以上(农业农村部渔业渔政管理局等, 2021、2022、2023),其中,江苏和安徽两省在全国占比分别为46.29%、46.72%、45.88%和12.86%、12.81%、12.81%,持续位列全国第一、第三,苏皖两地的中华绒螯蟹养殖在全国具有举足轻重的地位。
经过30多年的发展,国内已建立一整套蟹苗生态化、规模化繁育体系。人工苗种占市场主导地位,主要分布在江苏等沿海区域(农业农村部渔业渔政管理局等, 2021、2022、2023)。但一些育苗生产单位为了降低生产成本,各地相互盲目引种,繁育时缺少种质检测环节,来源随机和混杂,这直接影响到蟹苗的质量,导致良种覆盖率较低,面临种质衰退风险,因此,当前市场对优质蟹种的需求缺口仍很大。不少大的养殖企业或者规模化养殖地区,考虑到成本、蟹苗稳定性等问题,已开展自主选择亲本后送沿海繁育,进行订单式蟹苗生产或者直接租借当地育苗场地自主繁育蟹苗。目前,各水系中华绒螯蟹的性状特征已相互渗透,长江水系中华绒螯蟹种质退化、混杂情况越来越严重(邓燕飞等, 2017; 苏雨等, 2019; 李晶晶等, 2019; 刘青等, 2015; Zhang et al, 2018),造成养殖的河蟹规格小、产量低、发病率高,养殖经济效益持续下滑,严重制约着我国河蟹养殖业的可持续发展。因此,目前中华绒螯蟹选育,纯正的野生甚至养殖群体作为育种基础群已不太现实,只能从现有养殖群体中进行选择,其中,江苏、安徽地区不仅是河蟹的主要自然分布区,还是主要养殖区,产量高、占比大,且养殖环境条件好,养殖技术高,因而,评估该地区养殖群体的遗传多样性现状具有重要的理论和现实意义。
本研究拟在分析养殖群体遗传背景的基础上,从中选取遗传多样性高且遗传距离适度的群体作为育种基础群,采取大规格亲本进行繁育的方法培育中华绒螯蟹良种,目前已对偶数年江苏、安徽4个主要养殖群体的遗传特征进行了分析(胡玉婷等, 2022)。由于中华绒螯蟹的生命周期通常为2年,绝大部分个体性成熟后繁殖1次(代)后即死亡,不能进行多年份重复繁殖,相邻2年份间繁殖个体难以发生生殖交流,因而具有较明显的奇年与偶年差异(王中清等, 2013)。故尚需在分析江苏和安徽中华绒螯蟹奇数年养殖群体遗传背景的基础上,分析其遗传多样性和遗传结构,为后续的遗传改良及新品种培育提供科学依据。
1 材料与方法 1.1 样品采集与DNA提取2021年11―12月,采集苏皖2省6个地区的中华绒螯蟹成蟹,样品信息见表 1。每个地区的采集样品均来自本地规模养殖基地,随机选取3个养殖池塘,每个池塘采集10只,雌雄比例为1∶1,其中,3只带回实验室途中死亡。事先调研了所有采样地区养殖基地中华绒螯蟹的生长性状:雌蟹养成规格集中在150~300 g,雄蟹养成规格集中在200~400 g;其蟹苗均来自江苏射阳、如东蟹苗繁育场,经引进后自主培育为扣蟹,再养殖为成蟹。
|
|
表 1 中华绒螯蟹样品信息 Tab.1 Sampling information of Eriocheir sinensis |
剪取样品蟹腿部肌肉,参照基因组提取试剂盒(天根DP304)的使用说明提取基因组DNA,基因组DNA分装后避光于–20 ℃保存备用。
1.2 PCR扩增与检测为方便与偶数年数据(胡玉婷等, 2022)比较,选取了相同的微卫星引物序列(肖起珍等, 2017、2018) (表 2),由生工生物工程(上海)有限公司合成含荧光标记(FAM和HEX)修饰的引物。微卫星位点的扩增反应体系、反应条件及检测保存方法均与胡玉婷等(2022)一致。委托上述公司进行STR分型检测,采用Genemarker 2.2软件对分型结果进行判读。
|
|
表 2 中华绒螯蟹10对微卫星引物特征 Tab.2 Characteristics of microsatellite primers of E. sinensis |
使用CONVERT 1.31软件(Glaubitz, 2004)转换基因型数据为各种软件格式,Popgene 1.32 (Yeh et al, 1997)计算等位基因数(Na)、有效等位基因数(Ne)、期望杂合度(He)、观测杂合度(Ho)、近交系数(Fis)及遗传距离(Dn),并用马尔科夫链方法进行Hardy-Weinberg平衡分析,PIC_CALC 0.6软件(Nagy et al, 2012)计算多态信息含量(PIC)。利用Arlequin 3.5软件(Excoffier et al, 2010)进行群体分子方差分析(analysis of molecular variance, AMOVA)和遗传分化系数(Fst)。用MEGA 4.0软件(Kumar et al, 2008)基于群体间遗传距离构建UPGMA系统树。根据各位点等位基因频率,应用Bottleneck软件(Piry et al, 1999)中的符号检验(sign test)和符号秩次检验(Wilcoxon sign-rank),检验3种突变模型(IAM、TPM和SMM)假设下的突变–漂移平衡(mutation-drift equilibrium)。用软件Structure 2.3.4 (Porras et al, 2013)进行遗传聚类分析,确定最佳K值,结果使用Clumpp (Mattias et al, 2007)软件打开,采用Distruct (Rosenberg, 2004)软件绘图。
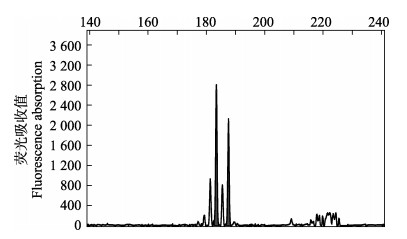
2 结果与分析 2.1 微卫星位点多态性10个微卫星位点在177个中华绒螯蟹样品中均可稳定扩增出条带,示例如图 1所示;分析其多样性,结果见表 3:等位基因数Na (10~49,平均为26.6),有效等位基因数Ne (4.89~31.81,平均为14.94),多态性都较高。期望杂合度(He)为0.798~0.971,平均为0.912;多态信息含量(PIC)为0.767~0.968,平均为0.875,均大于0.5的高度多态性标准。

|
图 1 位点SSR271在样品GC4中的等位基因分型 Fig.1 Allele genotyping of microsatellite locus SSR271 for sample GC4 |
|
|
表 3 中华绒螯蟹10个微卫星位点的多态性 Tab.3 Genetic diversity parameters among 10 loci of E. sinensis |
6个养殖群体的遗传多样性水平均较高,且遗传多样性水平相近(Na=16.0~18.4,Ne=10.1~12.4,Ho=0.759~ 0.836,He=0.897~0.916,PIC=0.870~0.892),其中,宜兴群体(YX)的等位基因数Na、期望杂合度He和多态信息含量PIC均最高,张家港群体(ZJG)的有效等位基因数Ne、观测杂合度Ho最高;而张家港群体的等位基因数Na、期望杂合度He和多态信息含量PIC均最低(表 4)。10个位点在6个群体中的近交系数(Fis)共有43个正值,17个负值,且每个群体中都有至少1个位点的近交系数(Fis)为负值(表 5)。
|
|
表 4 基于微卫星标记的中华绒螯蟹6个养殖群体的遗传多样性 Tab.4 Genetic diversity of six cultured populations of E. sinensis based on microsatellite marker |
|
|
表 5 中华绒螯蟹6个养殖群体的近交系数(Fis) Tab.5 Fis value of six cultured populations of E. sinensis based on microsatellite marker |
Hardy-Weinberg平衡检验6个养殖群体在10个微卫星位点上的基因平衡状态。结果发现,6个群体在7个位点上共26个数据显著偏离平衡(P < 0.05),占比43.3%,其中,22个数据表现为极显著偏离平衡(P < 0.01) (表 6)。表明这些养殖群体的遗传结构处于相对不稳定的状态。
|
|
表 6 Hardy-Weinberg平衡的卡方检验概率值(P) Tab.6 Hardy-Weinberg equilibrium Chi-square test probability value (P) |
群体间遗传距离分析结果表明(表 7),各群体间的Nei´s遗传距离为0.154~0.277,群体间最小、最大遗传距离分别出现在张家港和无为群体、溧阳和高淳群体之间;群体间遗传分化系数为0.001~0.011,全部 < 0.05,溧阳和高淳群体间遗传分化程度最大。AMOVA结果显示(表 8),总遗传变异中0.47%来自群体间,99.53%来自群体内,说明样本群体的遗传变异主要发生在群体内。上述分析表明,6个中华绒螯蟹养殖群体之间无显著遗传分化。
|
|
表 7 中华绒螯蟹群体间遗传距离(对角线下)和遗传分化指数(对角线上) Tab.7 Genetic distance (above diagonal) and genetic differentiation coefficient (below diagonal) between populations of E. sinensis |
|
|
表 8 中华绒螯蟹6个养殖群体的AMOVA分析 Tab.8 AMOVA analysis of six cultured populations of E. sinensis |
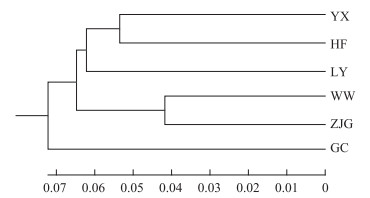
基于上述遗传距离用UPGMA法构建的群体系统发育树表明,6个养殖群体具有共同的祖先型,宜兴和合肥群体、无为和张家港群体首先聚为一支,互为姊妹群,然后前者和溧阳群体聚类后再与后者聚类,最后与高淳群体聚类,表明高淳群体与其他群体亲缘关系较远(图 2)。

|
图 2 中华绒螯蟹6个养殖群体的UPGMA系统发育树 Fig.2 Phylogenetic tree of UPGMA from six cultured populations of E. sinensis |
预设理论遗传组数K为2~6进行分析,遗传聚类见图 3,显示混乱的遗传结构未能聚成相对独立的群体。最佳遗传聚类组数K=3,此时各群体在每个遗传组中的样品分布见表 9,各群体在每个遗传组中均有样品分布,但没有1个主要分布组,样品占比范围为24.27%~42.10%,都小于50%。说明6个养殖群体种质来源复杂,且不同群体间存在相似的遗传组成,遗传分化不明显。

|
图 3 中华绒螯蟹6个养殖群体的遗传结构 Fig.3 Genetic ancestry of 6 cultured populations of E. sinensis |
|
|
表 9 最佳聚类分组时各群体样品在不同谱系中的分布 Tab.9 The distribution of population samples in different lineages during optimal clustering grouping |
IAM假设下,Sign test显示除高淳外的群体均偏离了突变–漂移平衡,表现出杂合显著过剩;Wilcoxon sign-rank显示,所有群体均偏离了突变–漂移平衡。TPM假设下,Sign test显示,仅无为群体偏离突变–漂移平衡;Wilcoxon sign-rank显示,除高淳、溧阳群体外均偏离突变–漂移平衡,表现为杂合过剩。SMM假设下,仅张家港群体偏离突变–漂移平衡,表现为杂合缺失。上述结果见表 10。
|
|
表 10 中华绒螯蟹6个群体的突变–漂移平衡分析 Tab.10 Results of mutation-drift equilibrium tests of the 6 populations of E. sinensis |
遗传多样性水平与物种对环境的适应能力呈正相关(Frankham, 2005),其遗传多样性参数如Ne、Ho及PIC等越大,表明物种的适应能力越好、进化潜力越大(胡玉婷等, 2020; 李伟强等, 2020)。研究结果显示,奇数年江苏、安徽中华绒螯蟹6个养殖群体的遗传多样性(Na=16.0~18.4,Ne=10.1~12.4,Ho=0.759~ 0.836,He=0.897~0.916,PIC=0.870~0.892)都处于较高水平且相近,这高于奇数年中华绒螯蟹3个人工选育群体(“长江1号”、“光合1号”和七里海群体)和1个海河自然群体的遗传多样性水平(Ne为4.79~5.87,He为0.720~0.745,PIC为0.687~0.716 (李晶晶等, 2019);还高于中华绒螯蟹单年系F5代选育群体、“长江2号”和长江野生群体的遗传多样性(Na=7.00~7.67,Ne=5.085~5.718,Ho=0.722~0.780,He=0.791~0.908,PIC=0.780~0.895) (田间等, 2023);但与中华绒螯蟹“长荡湖1号”连续3个世代的遗传多样性水平(平均值Na=27.55、Ne=13.61、Ho=0.72、He=0.90,PIC=0.89)相当(庄振俊等, 2023)。与偶数年4个群体(无为、高淳、宜兴和张家港)总的遗传多样性(Ne: 9.81~11.66; He: 0.904~0.918; PIC: 0.874~0.891)结果十分相近(胡玉婷等, 2022);比较4对群体的奇、偶数年遗传多样性高低,除奇数年宜兴群体略高外,其余群体对间均相近。这些一致表明,苏皖地区中华绒螯蟹群体遗传多样性水平普遍较高,具有较大的选育潜力。
中华绒螯蟹6个养殖群体间的遗传距离(0.154~0.277)、遗传分化系数Fst大小为0.001~0.011,均较小且远小于0.05的显著遗传分化标准(Balloux et al, 2002),AMOVA结果中群体间遗传变异仅占0.47%,表明这些不同群体间亲缘关系较近,不存在显著的遗传分化,可能具有相似的亲本来源。群体间系统发育树显示,6个养殖群体具有共同的祖先型,宜兴和合肥群体、无为和张家港群体首先聚为一支,前者和溧阳群体聚类后再依次与后者、高淳群体聚类。这再次表明,养殖群体间尤其是宜兴和合肥群体、无为和张家港群体间的原苗种供应地有重叠,在群体间总体亲缘关系较近的前提下,高淳群体与其他群体亲缘关系最远,考虑到该群体较高的遗传多样性(Na: 17.7; He: 0.909; PIC: 0.884),可作为群体选育的基础群之一。
近交系数Fis值常用于评估群体内个体间的近交程度。本研究中,10个位点在6个群体中的近交系数(Fis)共有43个正值和17个负值,且每个群体中都有正、负值,说明中华绒螯蟹6个养殖群体不仅都存在一定程度的近交,而且还存在少量的远缘繁殖。考虑到这些群体高遗传多样性水平,以及Structure遗传结构分析结果中各群体具有相似的遗传组成,但每个群体的遗传谱系来源多样,与偶数年研究结果相似(胡玉婷等, 2022),据此分析可能其亲本群体来源较为复杂,这些养殖群体内应该存在较大程度的种质混杂。20世纪80年代以来,随着中华绒螯蟹养殖产业的规模化发展,过度捕捞野生自然资源、跨区域无序引种、养殖群体逃逸等大大加剧了不同地理群体甚至流域间中华绒螯蟹种群的种质混杂。许多研究也证明,不同水系中华绒螯蟹群体存在种质混杂现象,甚至养殖群体也存在严重的种质混杂(邓燕飞等, 2017; 苏雨等, 2019; 李晶晶等, 2019; 刘青等, 2015; Zhang et al, 2018; 胡玉婷等, 2022; 肖起珍等, 2017; 周华兴等, 2022)。
Hardy-Weinberg平衡检验发现,43.3%的数据偏离平衡,表明这些养殖群体的遗传结构处于相对不稳定的状态。一些研究认为,微卫星数据更符合TPM模型,Wilcoxon符号秩次检验比符号检验的统计效率相对较高(Di et al, 1994; Cornuet et al, 1996)。本研究瓶颈效应分析中,无为、宜兴、张家港、合肥4个群体偏离突变–漂移平衡,经历了瓶颈效应,且都表现为杂合过剩,这与高达43.3%的微卫星位点偏离Hardy-Weinberg平衡的结果相对应。通常处于突变–漂移平衡下的种群,微卫星位点的杂合过剩与不足概率相近(Cornuet et al, 1996),但种群在经历了瓶颈效应后,等位基因数目与基因多样性(杂合度)均会降低,其中,等位基因的丢失比杂合度降低速度快,从而导致杂合过剩(Nei et al, 1975)。许多研究(吴明林等, 2020; 朱皓东, 2022; 王九龙等, 2024)均表明,由于人为定向选择,养殖群体比野生群体通常更易发生瓶颈效应和种质同质化,但本研究中,群体遗传多样性较高的原因可能是遗传差异大的种质混杂的结果。
综上,苏皖地区中华绒螯蟹养殖群体遗传多样性仍然较高,具有潜在的开发与利用价值,但其可能存在种质混杂。因此,在开展后续的良种选育时,需对养殖群体做进一步的研究,如采用敏感度高、可用于鉴别不同水系中华绒螯蟹的分子标记分析混杂种质来源,繁育前开展种质检测,进而提纯种质,使其种质资源得到合理的可持续性利用。
BALLOUX F, LUGON M N. The estimation of population differentiation with microsatellite markers. Molecular Ecology, 2002, 11(2): 155-165 DOI:10.1046/j.0962-1083.2001.01436.x |
Bureau of Fisheries, Ministry of Agriculture and Rural Affairs, National Fisheries Technology Extension Center, China Society of Fisheries. China fishery statistical yearbook. Beijing: China Agriculture Press, 2021, 2022, 2023 [农业农村部渔业渔政管理局, 全国水产技术推广总站, 中国水产学会. 中国渔业统计年鉴. 北京: 中国农业出版社, 2021, 2022, 2023]
|
CHEN L Q, DU N S. Biology of the Chinese mitten crab (Eriocheir sinensis). Beijing: Science Press, 2017: 11-13 [陈立侨, 堵南山. 中华绒螯蟹生物学. 北京: 科学出版社, 2017: 11-13]
|
CORNUET J M, LUIKART G. Description and power analysis of two tests for detecting recent population bottlenecks from allele frequency data. Genetics, 1996, 144(4): 2001-2014 DOI:10.1093/genetics/144.4.2001 |
DENG Y F, XU Y, XU Z Q, et al. Progress in genetic breeding of Eriocheir sinensis. Aquaculture, 2017, 38(6): 39-42 [邓燕飞, 徐宇, 许志强, 等. 中华绒螯蟹遗传育种进展. 水产养殖, 2017, 38(6): 39-42] |
DI R A, PETERSON A C, GARZA J C, et al. Mutational processes of simple-sequence repeat loci in human populations. Proceedings of the National Academy of Sciences, 1994, 91(8): 3166-3170 DOI:10.1073/pnas.91.8.3166 |
EXCOFFIER L, LISCHER H E L. Arlequin suite ver 3.5: A new series of programs to perform population genetics analyses under Linux and Windows. Molecular Ecology Resources, 2010, 10: 564-567 |
FRANKHAM R. Genetics and extinction. Biological Conservation, 2005, 126(2): 131-140 DOI:10.1016/j.biocon.2005.05.002 |
GLAUBITZ J C. Convert: A user-friendly program to reformat diploid genotypic data for commonly used population genetic software packages. Molecular Ecology Notes, 2004, 4(2): 309-310 DOI:10.1111/j.1471-8286.2004.00597.x |
HU Y T, JIANG H, DUAN G Q, et al. Genetic diversity analysis of Pelteobagrus fulvidraco from two major drainage systems in Anhui Province based on microsatellite markers. South China Fisheries Science, 2020, 16(5): 33-41 [胡玉婷, 江河, 段国庆, 等. 安徽两水系黄颡鱼的微卫星遗传多样性分析. 南方水产科学, 2020, 16(5): 33-41] |
HU Y T, LI J, JIANG H, et al. Genetic diversity and structure analysis of four Eriocheir sinensis cultured population. Jiangsu Agricultural Sciences, 2022, 50(16): 54-59 [胡玉婷, 凌俊, 江河, 等. 中华绒螯蟹4个养殖群体遗传多样性与遗传结构分析. 江苏农业科学, 2022, 50(16): 54-59] |
KUMAR S, DUDLEY J, NEI M et al. MEGA: A biologist- centric software for evolutionary analysis of DNA and protein sequences. Briefings in Bioinformatics, 2008, 9(4): 299-306 DOI:10.1093/bib/bbn017 |
LI J J, CHEN L M, GENG X Y, et al. Genetic diversity analysis of wild and cultured population of Eriocheir sinensis from different water systems. Progress in Fishery Sciences, 2019, 40(6): 105-113 [李晶晶, 陈丽梅, 耿绪云, 等. 中华绒螯蟹野生群体和不同水系人工选育群体的遗传多样性分析. 渔业科学进展, 2019, 40(6): 105-113] |
LI W Q, CHEN G, MA Q, et al. Genetic diversity in five cultured population of cobia (Rachycentron canadum) using microsatellite markers. Progress in Fishery Sciences, 2020, 41(2): 113-120 [李伟强, 陈刚, 马骞, 等. 利用微卫星标记分析军曹鱼养殖群体的遗传多样性. 渔业科学进展, 2020, 41(2): 113-120] |
LIU Q, LIU H, WU X G, et al. Genetic varition of wild and cultured populations of Chinese mitten crab Eriocheir sinensis from the Yangze, Huanghe, and Liaohe River basins using microsatellite marker. Oceanologia et Limnologia Sinica, 2015, 46(4): 958-968 [刘青, 刘皓, 吴旭干, 等. 长江、黄河和辽河水系中华绒螯蟹野生和养殖群体遗传变异的微卫星分析. 海洋与湖沼, 2015, 46(4): 958-968] |
MATTIAS J, NOAH A R. CLUMPP: A cluster matching and permutation program for dealing with label switching and multimodality in analysis of population structure. Bioinformatics, 2007, 23(14): 1801-1806 |
NAGY S, POCZAI P, CERNAK I, et al. PICcalc: An online program to calculate polymorphic information content for molecular genetic studies. Biochemical Genetics, 2012, 50(9): 670-672 |
NEI M, MARUYAMA T, CHAKRABORTY R. The bottleneck effect and genetic variability in populations. Evolution, 1975, 1-10 |
PIRY S, LUIKART G, CORNUET J M. Bottleneck: A computer program for detecting recent reductions in the effective size using allele frequency data. Journal of Heredity, 1999, 90(4): 502-503 |
PORRAS H L, RUIZ Y, SANTOS C, et al. An overview of structure: Applications, parameter settings, and supporting software. Frontiers in Genetics, 2013, 4: 98 |
ROSENBERG N A. DISTRUCT: A program for the graphical display of population structure. Molecular Ecology Notes, 2004, 4(1): 137-138 |
SU Y, ZHANG C, LI Q Q, et al. Genetic diversity analysis of wild and cultured Eriocheir sinensis populations from the Yangtze River, Yellow River, and Liaohe River based on the mitochondrial D-loop gene. Jounral of Fishery sciences of China, 2019, 26(3): 436-444 [苏雨, 张成, 李清清, 等. 中华绒螯蟹长江、黄河和辽河水系野生和养殖群体的遗传多样性. 中国水产科学, 2019, 26(3): 436-444] |
TIAN J, MA X K, ZENG J C, et al. Genetic diversity analysis of Chinese mitten crab based on microsatellite markers. Aquaculture, 2023(5): 20-25 [田间, 马行空, 曾健成, 等. 基于微卫星标记的中华绒螯蟹遗传多样性分析. 水产养殖, 2023(5): 20-25] |
WANG J L, YE M, LI H L, et al. Genetic diversity analysis for Thamnaconus modestus wild and cultured populations revealed by microsatellite markers. Fisheries Science, 2024, 43(2): 312-318 [王九龙, 叶苗, 李洪莉, 等. 绿鳍马面鲀野生与养殖群体的微卫星遗传多样性分析. 水产科学, 2024, 43(2): 312-318] |
WANG Z Q, HUANG S, MAO H C, et al. Genetic differentiation analysis of the even and odd year populations of Chinese mitten crab. Journal of Shanghai Ocean University, 2013, 22(5): 657-664 [王中清, 黄姝, 茅海成, 等. 中华绒螯蟹奇、偶年天然群体的遗传差异分析. 上海海洋大学学报, 2013, 22(5): 657-664] |
WU M L, HOU G J, LI H Y, et al. Genetic diversity assessment between Changjiang wild and two cultured populations of Cyprinus carpio. Genomics and Applied Biology, 2020, 39(1): 70-78 [吴明林, 侯冠军, 李海洋, 等. 长江野鲤(Cyprinus carpio)及两种养殖鲤群体遗传多样性评估. 基因组学与应用生物学, 2020, 39(1): 70-78] |
XIAO Q Z, LIU Q, LI Q Q, et al. Development and application of multiplex PCR panels of microsatellites in Chinese mitten crab (Eriocheir sinensis). Journal of Fishery Sciences of China, 2018, 25(2): 325-335 [肖起珍, 刘青, 李清清, 等. 中华绒螯蟹微卫星多重PCR体系的建立及其亲子鉴定应用. 中国水产科学, 2018, 25(2): 325-335] |
XIAO Q Z, LIU Q, WU X G, et al. Genetic diversity analysis of wild and cultured megalopa population of Eriocheir sinensis from Yangtze River. Genomics and Applied Biology, 2017, 36(5): 1935-1945 [肖起珍, 刘青, 吴旭干, 等. 长江水系中华绒螯蟹野生和人工繁殖大眼幼体的遗传多样性分析. 基因组学与应用生物学, 2017, 36(5): 1935-1945] |
YEH F C, BOYLE T J B. Population genetic analysis of codominant and dominant markers and quantitative traits. Belgian Journal of Botany, 1997, 129: 157-163 |
ZHANG C, LI Q Q, WU X G, et al. Genetic diversity and genetic structure of farmed and wild Chinese mitten crab (Eriocheir sinensis) populations from three major basins by mitochondrial DNA COI and Cyt b gene sequences. Mitochondrial DNA Part A: DNA Mapping, Sequencing, and Analysis, 2018, 29(7): 1081-1089 |
ZHOU H X, DUAN G Q, JIANG H, et al. Population genetics of Chinese mitten crab between the breeding and wild populations. Journal of Agriculture, 2022, 12(6): 55-59 [周华兴, 段国庆, 江河, 等. 中华绒螯蟹养殖群体与野生群体的种群遗传学研究. 农学学报, 2022, 12(6): 55-59] |
ZHU H D. Morphological and genetic diversity of wild and cultured stocks of Macrobrachium rosenbergii. Master´s Thesis of Shanghai Ocean University, 2022 [朱皓东. 罗氏沼虾野生和养殖群体形态学及遗传多样性研究. 上海海洋大学硕士研究生学位论文, 2022]
|
ZHUANG Z J, TANG M J, ZHANG D D, et al. Genetic diversity of three consecutive generations of Eriocheir sinensis "Changdang Lake 1". Acta Hydrobiologica Sinica, 2023, 47(9): 1523-1533 [庄振俊, 唐美君, 张冬冬, 等. 中华绒螯蟹"长荡湖1号"连续3个世代的遗传多样性分析. 水生生物学报, 2023, 47(9): 1523-1533] |


