2. 青岛海洋科学与技术试点国家实验室海洋渔业科学与食物产出过程功能实验室 山东 青岛 266071
2. Laboratory for Marine Fisheries Science and Food Production Processes, Pilot National Laboratory for Marine Science and Technology (Qingdao), Qingdao, Shandong 266071, China
近年来,温室气体的过度排放加剧了全球气候变化。我国是第一人口大国,同时,也是温室气体排放第一大国(方琦等, 2021)。为应对气候变化,我国政府郑重提出CO2排放量将在2030年左右达到峰值,在2060年之前实现“碳中和”的宏伟目标。海洋是地球上最大的活跃碳库,海洋负排放潜力巨大。中国是世界上海水养殖规模和产量最大的国家,然而,就某一项水产养殖产品而言,在其养殖周期内CO2的源汇并不清楚。碳足迹是指商品或服务在生产、运输、使用、处置的整个生命周期内排放的温室气体总量,以CO2当量(CO2e)表示(Minx et al, 2009)。通过开展水产养殖产品的碳足迹评估,不仅能为减排增汇提供科学的理论指导,还能为海洋负排放技术提供具体科学的数据支持,最终可服务于国家碳中和战略(焦念志等, 2021)。
山东省东临黄海北接渤海,海岸线长,海藻养殖行业发达。2020年全省养殖海藻产量为66.92万t,其中,海带(Saccharina japonica)产量为50.92万t,占全省养殖海藻产量的76%,约占全国海带总产量(165.16万t)的30% (农业农村部渔业渔政管理局等, 2021)。海带在生长过程中能够吸收大量的溶解CO2并将其转化为有机碳,与此同时,海水中CO2浓度降低会加速大气CO2的溶解(张继红等, 2021)。海带同时也是桑沟湾沉积物有机质的主要来源(聂梦晨等, 2022; Sui et al, 2019),这些过程起到了很好的碳汇作用。海带养殖活动又存在大量的物质和能源投入,这些投入会直接或间接释放CO2。我们对于获得海带产品的整个养殖生产过程中CO2的源/汇效应并不清楚。为定量分析养殖海带CO2的源汇情况,需要对养殖海带进行碳足迹评估。本研究以山东荣成市桑沟湾为例,基于生命周期评价理论构建了筏式养殖海带碳足迹测算方法,对桑沟湾养殖海带的碳足迹进行计算,分析碳足迹的主要影响因素和可能的误差来源,以期深入了解大型藻类养殖各个阶段的源汇效应,为有针对性的减排增汇技术的建立提供科技支撑。
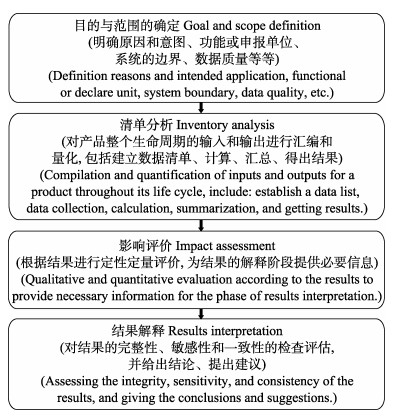
1 研究方法 1.1 生命周期评价法本研究基于生命周期评价法(life cycle assessment, LCA) (ISO, 1999)的理论构建了筏式养殖海带碳足迹测算方法。生命周期评价法主要包括目的与范围的确定、清单分析、影响评价和结果解释4个步骤。各步骤的具体内容见图1。
|
图 1 生命周期评价法的4个步骤 Fig.1 Four steps in life cycle assessment |
养殖海带作为海域的初级生产者,通过光合作用吸收水体中的无机碳、营养盐等合成有机质,其生长过程可吸收固定碳。海带养殖形成海带产品还包括育苗、养成过程中的用电、用船、养殖设施等释放CO2过程。海带苗为北方海带苗种,以荣成市寻山集团所育之苗为例。北方海带育苗需要低温、流水等条件(张壮志等, 2010),育苗工作通常在8月初开始,在10月上、中旬达到出库要求后出库暂养,整个育苗周期约为70 d,单位苗帘的育苗量为5万株/帘。海带成体为山东海区筏式平养法养殖海带,以荣成市桑沟湾为例。海带苗经15 d左右暂养达到分苗规格后开始分苗,具体包括剔苗、运苗、夹苗、挂苗4步操作。海区平均放苗量为75 000株/hm2 (刘涛, 2019),平均产量约为119 t/hm2,即每养殖1 t海带约需630株苗。通常10月底或11月初开始下海挂苗,次年5—7月初完成收获,整个养殖周期约为200 d。
本研究将生产1 t海带(湿重)记为养殖海带碳足迹的功能单位。采用从“摇篮到大门”的生命周期法,将养殖海带形成海带产品的整个生命周期划分为育苗期、运输阶段、养成期3个阶段。从第1天育苗开始到育苗结束为育苗期,海带苗帘由育苗场运输到养殖场为运输阶段,从海上挂苗养殖开始到海带收获上岸为养成期。本研究对于养殖海带碳足迹的计算仅包括CO2一种温室气体,不包含CH4和N2O等其他温室气体。
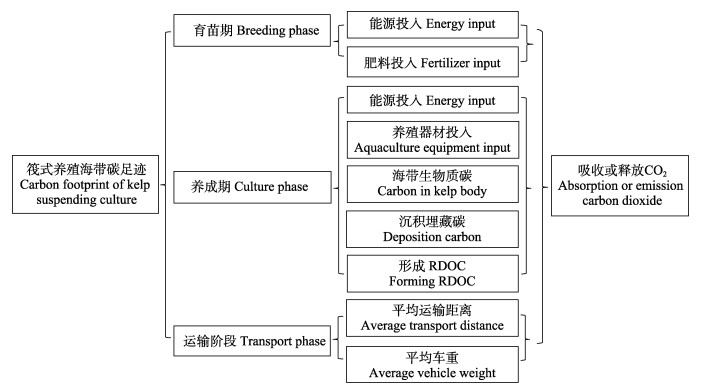
1.2.2 筏式养殖海带清单分析筏式养殖海带清单见图2。育苗期主要考虑能源和营养盐投入,运输期主要考虑公路运输,养成期主要考虑能源、养殖设施的投入和海带生长过程固定的CO2。养殖海带在生长过程中会通过光合作用固定大量的碳,这些碳一部分会以生物质碳的形式存留,一部分会以溶解有机碳(DOC)和颗粒有机碳(POC)的形式释放到海水中(Weigel et al, 2021; 尼志杰等, 2022; Jiao et al, 2010)。这些DOC和POC可在“微生物碳泵”作用下转化为惰性溶解有机碳(RDOC)(张永雨等, 2017; Chen et al, 2020)或埋藏于海底而形成“长久”碳汇。海带生物质碳、形成的RDOC和沉积埋藏碳视为CO2负排放,记为负值。
|
图 2 筏式养殖海带清单分析内容 Fig.2 Inventory analysis of kelp suspending culture |
育苗期的生产投入均采用平均数,育苗期海带苗的生物质碳部分并入养成期统一计算。运输阶段:所有海带苗均来自荣成内部,养殖区与育苗场之间距离约为2 km。养成期的养殖器材每年的投入量按照10年的平均使用年限计算。养成期海带生物质碳根据海带干湿比(14.3%~16.7%) (刘涛, 2019; 毛玉泽等, 2018)和含碳率(23.92%±3.21%) (Zhang et al, 2012)进行计算。RDOC根据DOC释放量和DOC向RDOC转化率计算。这方面的研究数据不多。从已有的研究来看,海带的DOC的释放量范围为470.1~1030 mg C/(m2·d) (Gao et al, 2021; Weigel et al, 2021; 尼志杰等, 2022),大型藻类生长过程中释放的DOC转化为RDOC的比例在33%~78%范围内(Gao et al, 2021; Watanabe et al, 2020; Zhang et al, 2017; Krause-Jensen et al, 2016)。本研究计算的是桑沟湾养殖海带碳足迹,故采用Gao等(2021)对桑沟湾海带的研究结果进行计算,即海带生长过程中DOC释放率为470.1 mg C/(m2·d),DOC向RDOC的转化率为37.8%。沉积埋藏碳根据单位面积沉积碳年增量[83 g C/(m2·a)] (刘赛等, 2018)和单位产量(1 t)对应面积(78.8 m2)计算。
1.2.3 计算方法本研究依据生命周期评价法的要求,对山东省的养殖海带“从摇篮到大门”的碳足迹进行测算。计算公式为:
| $ {\text{CF}} = \sum\limits_{i = 1}^n V i \times Fi $ |
式中,CF为养殖海带碳足迹(kgCO2e),Vi表示第i种资源或能源的消耗/产出量;Fi表示第i种资源或能源的排放因子。
2 计算结果生产1 t海带的相关数据、数据来源和计算结果见表1。由表1可知,养殖海带的碳足迹为–95.93 kgCO2e/t,其中,海带的CO2吸收量为170.23 kgCO2e/t,排放量为74.30 kgCO2e/t (育苗期占2.24%,养成期占97.76%,运输阶段仅占0.000 05%)。
|
|
表 1 生产1 t海带的相关数据及碳足迹计算结果 Tab.1 Relevant data and carbon footprint calculation results for production of 1 t kelp |
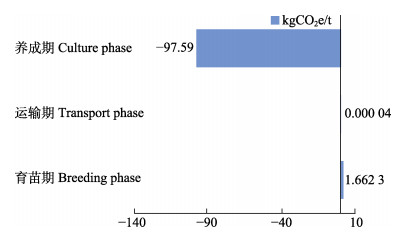
海带养殖各生产环节碳排放情况见图3。由图3可知,育苗期和苗种运输是碳排放环节,分别为1.66 kgCO2e/t和4.00×10–5 kgCO2e/t;海带养成期是碳汇环节,为–97.59 kgCO2e/t。
|
图 3 养殖海带各个生产环节的CO2排放量 Fig.3 CO2 emissions of each production phase of kelp mariculture |
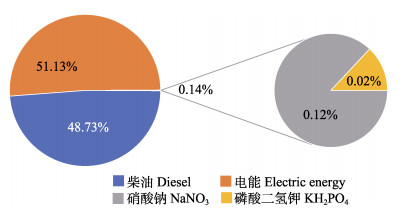
育苗期CO2排放情况见图4,育苗期碳排放源有4项,电能产生的碳排放为0.85 kgCO2e/t,占育苗期碳排放量的51.13%,为整个生命周期排放量的1.14%。育苗过程中柴油的碳排放量为0.81 kgCO2e/t,占育苗期碳排放量的48.73%,为整个生命周期排放量的1.09%;2种肥料使用过程排放量分别为2.00×10–3和3.00×10–4 kgCO2e/t,占育苗期碳排放量的0.14%。
|
图 4 育苗期各环节CO2排放占比 Fig.4 Proportion of CO2 emissions during the breeding phase |
海带养成期为CO2的汇(表1)。每养殖1 t海带能固定170.23 kgCO2,包括海带生物质碳固定136 kgCO2,占比约为79.9%,沉积埋藏碳固定23.98 kgCO2,占比约为14.1%,RDOC固定10.25 kgCO2,占比约为6.0%。养成期的养殖器材(包括聚乙烯材质的浮绠、橛绳等)产生的CO2排放量占养成期排放量的95.95%,为整个生命周期排放量的93.81%;养殖期间用船所消耗的柴油,其CO2排放量占养成期的4.05%。
3 分析与讨论养殖海带的碳足迹评估结果显示,养殖期的养殖设施器材是主要的CO2的源,是减排的关键控制点。聚乙烯材料具有抗腐蚀、拉力大等特点,是养殖海带所用的浮绠、橛绳等的主要材料,目前尚未有合适的低碳替代品。养殖器材计入碳足迹的CO2释放量是依据其使用年限来计算的,本研究按照通常的使用年限10年计量。因此,在积极研发低碳新材料的同时,可通过延长其使用年限的方式降低碳排放。经计算发现,养殖器材的使用年限每延长1年可使养殖海带减排8%左右。建议养殖过程中加强日常维护和保养等管理手段,减少海水对其的损害等,以延长养殖设施器材的使用年限。
柴油、电等能源的消耗贯穿在育苗、苗种运输及养殖整个过程中。研究结果显示,因能源消耗而释放的CO2总计为4.6 kg,仅占CO2释放总量的6.19%,但是,本研究所用的海带苗来自荣成当地,并且养殖海域在桑沟湾内,离岸距离近,所以运输过程的CO2释放量不高。海带养殖区域没有足够的育苗场,苗种来自外地,养殖区逐渐从近岸向深远海扩展,都会因能源消耗的增加而增大CO2的排放量,会使得碳足迹增大。因此,调整能源结构,提高能源利用效率,促进海上风能、光伏等清洁能源的使用等措施在海带养殖产业中依然具有重大意义。另外,建议加强产业链的统筹布局,如基于养殖需苗量来配置育苗场,以减少运输过程的碳排放。
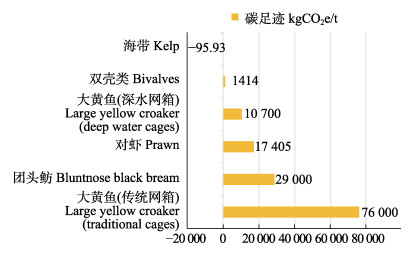
已有的基于生命周期评价法评估投饵型养殖生物的碳足迹(吴飞飞等, 2011; 付晓洋等, 2016; 朱林等, 2015; Gephart et al, 2021),结果显示(图5),养殖双壳类的碳足迹为1414 kgCO2e/t;养殖对虾的碳足迹为17 405 kgCO2e/t;团头鲂(Megalobrama amblycephala)的碳足迹约为29 000 kgCO2e/t;大黄鱼(Larimichthys crocea)通过改良养殖模式,可将其碳足迹从76 000 kgCO2e/t降至10 700 kgCO2e/t。养殖海带的碳足迹为–95.93 kgCO2e/t,能够起到养殖负排放的作用。海带之所以能发挥负排放的作用,主要源于其作为初级生产者的碳汇能力。最初的研究主要关注于养殖海带形成的生物质碳(张继红等, 2005)。随着研究的深入,证实沉积埋藏碳(Sui et al, 2019; 聂梦晨等, 2022)和海带生长过程释放DOC及碎屑在微生物作用下形成的RDOC (张永雨等, 2017)都是渔业碳汇的重要部分,也是海洋中长久稳定碳库的重要存在形式。如果不考虑RDOC和沉积埋藏部分,会使养殖海带的碳吸收低估近20%。本研究以桑沟湾的养殖海带为研究对象,得出每养殖1 t海带形成的RDOC能够固定10.25 kgCO2。已有研究结果显示,褐藻生长过程中释放DOC的范围为310~1030 mg C/(m2·d) (Gao et al, 2021; Weigel et al, 2021; 尼志杰等, 2022; Reed et al, 2015);释放DOC向RDOC转化比例为33%~ 78% (Gao et al, 2021; Watanabe et al, 2020; Zhang et al, 2017; Krause-Jensen et al, 2016)。若按照以上结果来计算,养殖1 t海带能够形成的RDOC可能在5.90~46.35 kgCO2范围。另外,大型藻类碎屑形成的POC一部分直接沉降形成沉积埋藏碳,另一部分则会在“微生物碳泵”的作用下形成DOC,继而形成RDOC (Jiao et al, 2010; Chen et al, 2020)。然而,迄今为止未见海带碎屑形成RDOC的相关报道,所以,本研究并未将海带碎屑形成的RDOC部分计算在内,可能会使测算结果偏低。目前,能查到的相关报道显示,浮游植物(蓝藻)降解产生的RDOC约占其干重的7% (Shi et al, 2017);浒苔(Ulva prolifera)生物体降解产生的RDOC约占藻类生物质碳的1.6% (Chen et al, 2020)。按照以上的比例计算,海带在养殖过程中形成的碎屑直接降解产生的RDOC可能为其总固碳的4.0%~17.5%。当然,不同海区的养殖条件、养殖品种、养殖模式的差异也会使得不同养殖区之间形成沉积埋藏碳的速率存在差异。鉴于RDOC碳汇量的不确定性和不同海区之间形成沉积埋藏碳速率的差异,因此,需要深入研究RDOC的形成过程与机制、沉积埋藏碳的沉积速率等问题,以提高碳足迹的计算精度。随着我们对养殖海藻(海带等)碳汇功能认知的深入,大型藻类养殖在海洋负排放中将会发挥更大的作用。
|
图 5 不同养殖品种碳足迹对比 Fig.5 Comparison of carbon footprints of different breeding species |
Bureau of Fisheries, Ministry of Agriculture and Rural Affairs, National Fisheries Technology Extension Center, China Society of Fisheries. China fishery statistical yearbook 2021. Beijing: China Agriculture Press, 2021 [农业农村部渔业渔政管理局, 全国水产技术推广总站, 中国水产学会. 2021中国渔业统计年鉴. 北京: 中国农业出版社, 2021]
|
CHEN J, LI H M, ZHANG Z H, et al. DOC dynamics and bacterial community succession during long-term degradation of Ulva prolifera and their implications for the legacy effect of green tides on refractory DOC pool in seawater. Water Research, 2020, 185: 116268 DOI:10.1016/j.watres.2020.116268 |
FANG Q, QIAN L H, LU Z W. Measure carbon emission amount of china in the context of carbon peak and carbon neutrality. Environmental Protection, 2021, 49(16): 51-56 [方琦, 钱立华, 鲁政委. 我国实现碳达峰与碳中和的碳排放量测算. 环境保护, 2021, 49(16): 51-56] |
FU X Y, ZHAO S, ZHU A Y, et al. Carbon footprint of large yellow croaker cage culture system based on life cycle assessment. China Water Transport, 2016, 16(3): 136-139 [付晓洋, 赵晟, 朱爱意, 等. 基于生命周期评价的大黄鱼网箱养殖系统的碳足迹. 中国水运, 2016, 16(3): 136-139] |
GAO Y P, Zhang Y T, DU M R, et al. Dissolved organic carbon from cultured kelp Saccharina japonica: Production, bioavailability, and bacterial degradation rates. Aquaculture Environment Interactions, 2021, 13: 101-110 DOI:10.3354/aei00393 |
GEPHART J A, HENRIKSSON P J G, PARKER R W R, et al. Environmental performance of blue foods. Nature, 2021, 597: 360-366 DOI:10.1038/s41586-021-03889-2 |
ISO. ISO14040-1999: International standards: Environmental management-life cycle assessment-principles and frameworks. Geneva: ISO, 1999
|
JIAO N Z, HERNDL G J, HANSELL D A, et al. Microbial production of recalcitrant dissolved organic matter: Long-term carbon storage in the global ocean. Nature Reviews Microbiology, 2010, 8: 593-599 DOI:10.1038/nrmicro2386 |
JIAO N Z, LIU J H, SHI T, et al. Deploying ocean negative carbon emissions to implement the carbon neutrality strategy. Science China Earth Sciences, 2021, 51(4): 632-643 [焦念志, 刘纪化, 石拓, 等. 实施海洋负排放践行碳中和战略. 中国科学:地球科学, 2021, 51(4): 632-643] |
KRAUSE-JENSEN D, AND DUARTE C M. Substantial role of macroalgae in marine carbon sequestration. Nature Geoscience, 2016, 9(10): 737-742 DOI:10.1038/ngeo2790 |
LI M. Life cycle assessment of polythylene plastic production and waste polythylene plastic reclamation technology. Master´s Thesis of Harbin Institute of Technology, 2008 [李蔓. 聚乙烯塑料生产和废聚乙烯塑料资源化技术生命周期评价. 哈尔滨工业大学硕士研究生学位论文, 2008]
|
LIU S, YANG S, YANG Q, et al. The long-term changes of annual carbon sequestration rate and regional difference in culture areas of Sanggou Bay. Haiyang Xuebao, 2018, 40(1): 47-56 [刘赛, 杨庶, 杨茜, 等. 桑沟湾沉积碳库年汇入速率的长期变化及其区域性差异. 海洋学报, 2018, 40(1): 47-56 DOI:10.3969/j.issn.0253-4193.2018.01.006] |
LIU T. Kelp culture technology. Qingdao: Ocean University of China Press, 2019 [刘涛. 海带养殖技术. 青岛: 中国海洋大学出版社, 2019]
|
MAO Y Z, LI J Q, XUE S Y, et al. Ecological functions of the kelp Saccharina japonica in integrated multi-trophic aquaculture, Sanggou Bay, China. Acta Ecologica Sinica, 2018, 38(9): 3230-3237 [毛玉泽, 李加琦, 薛素燕, 等. 海带养殖在桑沟湾多营养层次综合养殖系统中的生态功能. 生态学报, 2018, 38(9): 3230-3237] |
MINX J C, WIEDMANN T, WOOD R, et al. Input-output analysis and carbon footprinting: An overview of applications. Economic Systems Research, 2009, 21(3): 187-216 DOI:10.1080/09535310903541298 |
NI Z J, LI B, SUN Y Q, et al. Effects of light intensity and nutrients on dissolved organic carbon released from Saccharina japonica young seedling. Progress in Fishery Sciences, 2022, 43(5): 8-15 [尼志杰, 李斌, 孙琰晴, 等. 光照强度和营养盐对海带幼苗释放溶解有机碳的影响. 渔业科学进展, 2022, 43(5): 8-15] |
NIE M C, HUANG C L, SUI Q, et al. Carbon and nitrogen stable isotope analysis and source analysis of organic matter in sediments of Sanggou Bay. Progress in Fishery Sciences, 2022, 43(5): 84-97 [聂梦晨, 黄翠玲, 隋琪, 等. 桑沟湾沉积物有机质的碳氮稳定同位素分析及其来源解析. 渔业科学进展, 2022, 43(5): 84-97] |
REED D C, CARLSON C A, HALEWOOD E R, et al. Patterns and controls of reef-scale production of dissolved organic carbon by giant kelp Macrocystis pyrifera. Limnology and Oceanography, 2015, 60(6): 1996-2008 DOI:10.1002/lno.10154 |
SHI L M, HUANG Y X, ZHANG M, et al. Bacterial community dynamics and functional variation during the long-term decomposition of cyanobacterial blooms in-vitro. Science of the Total Environment, 2017, 598: 77-86 DOI:10.1016/j.scitotenv.2017.04.115 |
SUI J J, ZHANG J H, REN S J, et al. Organic carbon in the surface sediments from the intensive mariculture zone of Sanggou Bay: Distribution, seasonal variations and sources. Journal of Ocean University of China, 2019, 18(04): 985-996 DOI:10.1007/s11802-019-3768-y |
WATANABE K, YOSHIDA G, HORI M, et al. Macroalgal metabolism and lateral carbon flows can create significant carbon sinks. Biogeosciences, 2020, 17: 2425-2440 DOI:10.5194/bg-17-2425-2020 |
WEIGEL B L, PFISTER C A. The dynamics and stoichiometry of dissolved organic carbon release by kelp. Ecology, 2021, 102(2): e03221 |
WU F F, JI J Y, XU H D. Research on carbon footprint of shrimp pond farming based on LCA method. Chinese Management Science, 2011, 19(S): 668-672 [吴飞飞, 纪建悦, 许罕多. 基于LCA方法的对虾池塘养殖碳足迹研究. 中国管理科学, 2011, 19(S): 668-672] |
ZHANG J H, FANG J G, TANG Q S. The contribution of shellfish and seaweed mariculture in China to the carbon of coastal ecosystem. Advances in Earth Science, 2005, 20(3): 359-365 [张继红, 方建光, 唐启升. 中国浅海贝藻养殖对海洋碳循环的贡献. 地球科学进展, 2005, 20(3): 359-365 DOI:10.3321/j.issn:1001-8166.2005.03.014] |
ZHANG J H, FANG J G, WANG W, et al. Growth and loss of mariculture kelp Saccharina japonica in Sungo Bay, China. Journal of Applied Phycology, 2012, 24: 1209-1216 DOI:10.1007/s10811-011-9762-4 |
ZHANG J H, Liu J H, Zhang Y Y, et al. The strategic approach for mariculture to practice “Ocean Negative Carbon Emission”. Bulletin of the Chinese Academy of Sciences, 2021, 36(3): 241-247 [张继红, 刘纪化, 张永雨, 等. 海水养殖践行“海洋负排放”的途径. 中国科学院院刊, 2021, 36(3): 241-247] |
ZHANG T, WANG X C. Release and microbial degradation of dissolved organic matter (DOM) from the macroalgae Ulva prolifera. Marine Pollution Bulletin, 2017, 125(1/2): 192-198 |
ZHANG Y Y, ZHANG J H, LIANG Y T, et al. Carbon sequestration processes and mechanisms in coastal mariculture environments in China. Scientia Sinica Terrae, 2017, 47(12): 1414-1424 [张永雨, 张继红, 梁彦韬, 等. 中国近海养殖环境碳汇形成过程与机制. 中国科学:地球科学, 2017, 47(12): 1414-1424] |
ZHANG Z Z, CONG Y Z, QU S C, et al. The current situation and development trend of kelp breeding in northern China. Scientific Fish Farming, 2010(5): 1-3 [张壮志, 丛义周, 曲善村, 等. 我国北方海带育苗现状及发展趋势. 科学养鱼, 2010(5): 1-3] |
ZHU L, CHE X, LIU H. Greenhouse gas emissions of Megalobrama amblycephala culture pond ecosystems in summer. Journal of Shanxi Agricultural Sciences, 2015, 43(10): 1297-1300 [朱林, 车轩, 刘晃. 夏季团头鲂养殖池塘生态系统温室气体排放通量分析. 山西农业科学, 2015, 43(10): 1297-1300 DOI:10.3969/j.issn.1002-2481.2015.10.20] |


