2. 中国海洋大学水产学院 山东 青岛 266003;
3. 青岛海洋科学与技术试点国家实验室海洋渔业科学与食物产出过程功能实验室 山东 青岛 266071
2. College of Fisheries, Ocean University of China, Qingdao, Shandong 266003, China;
3. Laboratory for Marine Fisheries Science and Food Production Processes, Pilot National Laboratory for Marine Science and Technology (Qingdao), Qingdao, Shandong 266071, China
我国是世界海水贝类养殖第一大国,2020年海水贝类养殖产量达1 480.08万t (农业农村部渔业渔政管理局等, 2021)。从养殖种类来看,主要为滤食性贝类,产量占贝类养殖总产量的95%。作为一种不需要投饵的养殖类型,滤食性贝类养殖具有天然的“绿色”属性,在净化水质、减缓富营养化等方面发挥着积极的生态作用(Kaspar et al, 1985; Council, 2010; McKindsey et al, 2007),此外,研究表明,滤食性贝类通过摄食、生物沉积、钙化等生理过程影响着碳的海洋生物地球化学过程,具有非常重要的碳汇功能(Tang et al, 2011; Filgueira et al, 2015; 唐启升等, 2022)。从碳的视角来说,滤食性贝类养殖生态系统碳汇功能的充分发挥与浮游植物的种类、数量、周转率等密切相关,作为一种饵料来源依赖于水体中浮游植物等自然资源的养殖产业,高密度、不合理的滤食性贝类养殖会对浮游植物群落结构产生强烈的下行控制效应,不仅不能提高产量,而且可能对生态系统造成负面影响(Dame et al, 1985; Hatcher et al, 1994; 印丽云等, 2012)。
滤食性贝类与浮游植物间的互馈作用是否良性需要养殖容量理论的支撑。Inglis等(2000)将养殖容量划分为4种类型,分别是物理容量、产量容量、生态容量和社会容量。目前所说的贝类养殖容量通常是指产量容量,定义为对养殖生物的生长率不产生负面影响,并获得最大产量的养殖密度(McKindsey et al, 2006)。贝类养殖容量的评估方法,主要有经验研究法、瞬时生长率法、能量收支平衡法、营养动力学方法和生态系统动力学方法等5种方法(刘慧等, 2018)。前4种方法是根据历史数据和已有研究来评估养殖海域养殖容量,计算相对简单,数据要求较少,但考虑的指标较少,估算的养殖容量往往存在误差(Parsons et al, 1977; Officer et al, 1982; Rosenberg et al, 1983; Stillman et al, 2000)。生态系统动力学方法是通过构建生态系统模型,模拟生态系统内重要生源要素的关键生物地球化学过程及其相互作用,根据不同的评价标准评估养殖容量(Dowd, 1997; Filgueira et al, 2014)。随着对养殖容量概念的内涵和对生态系统结构与功能认识需求的不断深入,能够更加细致地描述养殖生态系统中养殖生物参与的物理、生物和化学过程及其相互作用的生态系统动力学方法成为国际上养殖容量研究的主流方向,目前已经在世界多个养殖海湾广泛应用(Jiang et al, 2005; Aure et al, 2007; Guyondet et al, 2013)。
胶州湾是我国北方重要的贝类规模化养殖区域,其中,菲律宾蛤仔(Ruditapes philippinarum)年产量达32.5万t,产量占胶州湾水产养殖总产量的91.5%,增养殖面积为9600 hm2,占总养殖面积的66.7% (张明亮, 2008)。近年来,胶州湾海域菲律宾蛤仔养殖产量趋于平稳,但出现了蛤仔生长周期延长、死亡率升高等超容量养殖迹象,亟需以养殖容量理论来指导产业发展。目前已有一些研究评估了胶州湾菲律宾蛤仔的养殖容量,如刘学海等(2015)结合初级生产力、浮游植物浓度和饵料收支平衡,建立了胶州湾生态模型,评估菲律宾蛤仔的养殖容量。董世鹏等(2020a)基于Dame指标和Herman模型估算了胶州湾菲律宾蛤仔的养殖容量,生物过程主要考虑了贝类对浮游植物的摄食,缺乏对其他生物作用的描绘,生物代谢、沉积和水交换等核心参数不够全面。本研究尝试通过耦合菲律宾蛤仔个体生长模型和生物地球化学模型,构建胶州湾营养盐–浮游植物–浮游动物–碎屑–菲律宾蛤仔(nutrients–photoplankton–zooplankton–detritus–clams, NPZD-C)生态系统动力学模型,并将经济效益和生态效益作为胶州湾菲律宾蛤仔养殖容量评估标准,评估胶州湾菲律宾蛤仔的养殖容量,提出蛤仔播种密度的养殖管理建议,期望为当地菲律宾蛤仔养殖产业发展规划提供数据支撑和决策参考。
1 材料与方法 1.1 模型描述将NPZD生态系统模型和贝类个体生长模型进行耦合,构建了胶州湾生态系统动力学模型。模型主要包括营养盐(N)、浮游植物(P)、浮游动物(Z)、碎屑(D)和蛤仔(C) 5个模块,以碳和氮作为各个模块之间交换量的单位。本模型所有的养殖生物和非养殖生物都在种群水平进行描述和运算。养殖区和非养殖区的浮游植物、浮游动物和碎屑通过水流进行交换,通过现场调查测定交换量,根据潮汐的周期变化得到交换频率。通过数据监测和海域调查得到水温和无机氮(
动态能量收支模型(DEB)理论通过结构体积、储备能量和繁育储能3个状态变量来描述贝类的能量分配过程,依据以上3个状态变量可以得到贝类个体体重。模型中蛤仔的储能变化率、繁育储能变化率、体积变化率、个体湿重可以分别用以下公式表达:
| $ \frac{dE}{dt}=\text{ }{p}_{A}-{p}_{C} $ | (1) |
| $ \frac{{d{E_R}}}{{dt}} = (1 - \kappa ){p_c} - {p_J} $ | (2) |
| $ \frac{{dV}}{{dt}} = \frac{{{{(\kappa \times {p_C} - {p_M})}_ + }}}{{[{E_G}]}} $ | (3) |
| $ W = \alpha \left[ {V \times \rho + \left( {\frac{E}{{{\mu _E}}} + \frac{{{\kappa _R} \times {E_R}}}{{{\mu _E}}}} \right)} \right] + \beta $ | (4) |
式中,
| $ \frac{{d{\text{MN}}}}{{dt}} = - {\delta _r} \times {\text{MN}} - {\delta _h} \times {\text{MN}} $ | (5) |
| $ {\text{Bi}}{{\text{o}}_b} = {\text{MN}} \times W $ | (6) |
| $ {\delta _r} = 5 \times {10^{ - 21}} \times {\text{M}}{{\text{N}}^{2.52}} $ | (7) |
式中,
生物对食物功能性反应和温度依赖关系可以用以下公式表示:
| $ \text{ }f=\frac{X}{X+{X}_{H}} $ | (8) |
| $ \begin{aligned} T_{\mathrm{emp}}=& k_{0} \exp \left\{\frac{T_{A}}{T_{0}}-\frac{T_{A}}{T}\right\} \\ &\left(1+\exp \left\{\frac{T_{\mathrm{AL}}}{T}-\frac{T_{\mathrm{AL}}}{T_{L}}\right\}+\exp \left\{\frac{T_{\mathrm{AH}}}{T_{H}}-\frac{T_{\mathrm{AH}}}{T}\right\}\right)^{-1} \end{aligned}$ | (9) |
式中,
| $ {p_A} = {T_{{\text{empB}}}} \times f \times \{ {P_{{\text{Am}}}}\} \times {V^{2/3}} $ | (10) |
| $ \begin{aligned} &p_{C}=T_{\mathrm{empB}} \times \\ &\frac{E}{\left[E_{G}\right]+\kappa \times E / V}\left(\frac{\left[E_{G}\right] \times\left\{p_{A}\right\} \times V^{\frac{2}{3}}}{\left[E_{M}\right]}+\left[p_{M}\right] \times V\right) \end{aligned}$ | (11) |
| $ {p_M} = {T_{{\text{empB}}}} \times [{p_M}] \times V $ | (12) |
| $ {p_J} = {T_{{\text{empB}}}} \times min(V,{V_P}) \times [{p_M}] \times \left( {\frac{{1 - \kappa }}{\kappa }} \right) $ | (13) |
| $ {U_{{\text{bp}}}} = {T_{{\text{empB}}}} \times {U_{{\text{bm}}}} \times {\text{CP}} \times {V^{2/3}} $ | (14) |
| $ {U_{{\text{bo}}}} = {T_{{\text{empB}}}} \times {U_{{\text{bm}}}} \times {\text{POC}} \times {V^{2/3}} $ | (15) |
| $ F = ({U_{{\text{bp}}}} + {U_{{\text{bo}}}}) - {p_A}/{\mu _{{\text{CJ}}}} $ | (16) |
| $\begin{aligned} M_{\operatorname{excr}}=&\left\{\left[p_{C}-\left(1-\kappa_{R}\right) \times \frac{d E_{R}}{d t}-\mu_{V} \times \rho \times \frac{d V}{d t}\right] \times\right.\\ &\left.Q+p_{A} \times\left(Q_{P}-Q_{m}\right)_{+}\right\} / \mu_{\mathrm{CJ}} \end{aligned}$ | (17) |
式中,
以碳和氮为单位计量的浮游植物随时间变化的函数可以分别用如下公式表达:
| $ \begin{gathered} \frac{{d{\text{CP}}}}{{dt}} = {U_{{\text{cp}}}} - {r_p} \times {T_{{\text{empP}}}} \times {\text{CP}} - \hfill \\ \;\;\;\;\;\;\;\;\;\;\;\;\;\;\;\;\;\;\;\;\;{U_{{\text{zp}}}} - {U_{{\text{bp}}}} \times \frac{{MN}}{V} - {M_p} + {\text{E}}{{\text{x}}_{{\text{CP}}}} \hfill \\ \end{gathered} $ | (18) |
| $ \begin{gathered} \frac{{d{\text{NP}}}}{{dt}} = {U_{{\text{np}}}} - {P_{{\text{excr}}}} - {r_p} \times {T_{{\text{empP}}}} \times {\text{NP}} - \hfill \\ \;\;\;\;\;\;\;\;\;\;\;\;\;\;\;\;\;\;\;\;\;{Q_p}{U_{{\text{zp}}}} - {Q_p}{U_{{\text{bp}}}} \times \frac{{{\text{MN}}}}{V} - {Q_p}{M_p} + {\text{E}}{{\text{x}}_{{\text{NP}}}} \hfill \\ \end{gathered} $ | (19) |
式中,
影响浮游植物生长繁殖的因素主要有浮游植物种类、水温、光照强度和营养盐浓度,其生物过程方程如下:
| $ L = L(t) \times exp\{ - [{k_{{\text{back}}}} + {k_p} \times ({\text{CP}} + {\text{CA}})]\} \times H $ | (20) |
| $ f(L) = \frac{1}{H} \times ex\int_0^H {L/(L + {X_l})dz} $ | (21) |
| $ {U_{{\text{cp}}}} = f(L) \times {\text{CP}} \times {T_{{\text{empP}}}} \times {G_{{\text{pm}}}} \times {\left( {1 - \frac{{{Q_{{\text{pmin}}}}}}{{{Q_p}}}} \right)_ + } $ | (22) |
| $ {U_{{\text{nhp}}}} = {U_{{\text{nhmp}}}} \times ({\text{NH}}/({\text{NH}} + {X_{{\text{pnh}}}}) $ | (23) |
| $ {U_{{\text{nop}}}} = {U_{{\text{nopm}}}} \times ({\text{NO}}/({\text{NO}} + {X_{{\text{pno}}}}) $ | (24) |
| $ \begin{aligned} &U_{\mathrm{np}}=\mathrm{NP} \times T_{\mathrm{empP}} \times \\ &\quad\left(U_{\mathrm{nhp}}+U_{\mathrm{nop}}\right) /\left\{1+\exp \left[\frac{Q_{p}-Q_{\mathrm{pmax}}}{Q_{\mathrm{poff}}}\right]\right\} \end{aligned}$ | (25) |
| $ {Q_p} = {\text{NP}}/{\text{CP}} $ | (26) |
式中,
| $ {P_{{\text{excr}}}} = {e_{{\text{up}}}} \times {U_{{\text{np}}}} + {r_p} \times {T_{{\text{empP}}}} \times {\text{CP}} \times {Q_p} $ | (27) |
| $ {M_p} = CP \times ({\delta _{{\text{pmin}}}} + {\delta _p} \times {({{\text{Q}}_{{\text{pmax}}}} - {Q_p})_ + }] $ | (28) |
式中,
浮游动物模块同样应用DEB理论,使用结构体积和储备能量描述其种群动态,其函数表达式为:
| $ \frac{{d{\text{CZ}}}}{{dt}} = {G_Z} - {\text{C}}{{\text{Z}}_{{\text{rho}}}} + {\text{E}}{{\text{x}}_{{\text{cz}}}} $ | (29) |
| $ \frac{{d{\text{EZ}}}}{{dt}} = (1 - {d_z})({U_{{\text{zp}}}} + {U_{{\text{zo}}}}) - {G_Z} - {\text{E}}{{\text{Z}}_{{\text{rho}}}} + {\text{E}}{{\text{x}}_{{\text{Ez}}}} $ | (30) |
式中,
| $ {G_z} = {G_{{\text{zm}}}} \times {\text{EZ}} \times {T_{{\text{empZ}}}} \times {\text{max}}\left\{ {0,1 - \frac{{{R_{{\text{zmin}}}}}}{{\left[ {\frac{{{\text{EZ}}}}{{{\text{CZ}} + {\text{EZ}}}}} \right]}}} \right\} $ | (31) |
| $ {U_{{\text{zp}}}} = {\text{CZ}} \times {U_{{\text{pzm}}}} \times \left[ {\frac{{{\text{CP}}}}{{{\text{CP}} + {X_{{\text{pz}}}}}}} \right] \times {\text{min}}\left( {\frac{{{Q_P}}}{{{Q_z}}},1} \right) $ | (32) |
| $ {U_{{\text{zo}}}} = {\text{CZ}} \times {U_{{\text{poczm}}}} \times \left[ {\frac{{{\text{POC}}}}{{{\text{POC}} + {X_{{\text{pocz}}}}}}} \right] \times {\text{min}}\left( {\frac{{{Q_o}}}{{{Q_z}}},1} \right) $ | (33) |
| $ {\text{C}}{{\text{Z}}_{{\text{rho}}}} = {\delta _{\text{z}}} \times {\text{CZ}} $ | (34) |
| $ {\text{E}}{{\text{Z}}_{{\text{rho}}}} = {\delta _{\text{z}}} \times {\text{EZ}} + {r_z} \times {\text{CZ}} \times {T_{{\text{empZ}}}} $ | (35) |
式中,
本模型使用颗粒有机碳(POC)和颗粒有机氮(PON)对碎屑(POM)进行描述,方程表达式如下:
| $ \begin{aligned} &\frac{d \mathrm{POC}}{d t}= \\ &\left(1-k_{\mathrm{sr}}-k_{\mathrm{db}}\right)\left[\frac{F_{m} \mathrm{MN}}{V}-\frac{U_{\mathrm{b} 0} \mathrm{MN}}{V}-\lambda_{0} \mathrm{POC}\right]+ \\ &\mathrm{Ex}_{\mathrm{POC}} \end{aligned} $ | (36) |
| $\begin{aligned} &\frac{d \mathrm{PON}}{d t}= \\ &\quad\left(1-k_{\mathrm{sr}}-k_{\mathrm{db}}\right)\left[\frac{Q_{p} F_{m} \mathrm{MN}}{V}-\frac{Q_{0} U_{\mathrm{mo}} \mathrm{MN}}{V}-\lambda_{0} \mathrm{PON}\right]+ \\ &\mathrm{Ex}_{\mathrm{PON}} \end{aligned} $ | (37) |
式中,
本模型将无机氮浓度作为模型的强制函数,具体又将其分为硝态氮(
为了构建生态模型,对蛤仔、浮游植物、浮游动物和碎屑各子模块进行了参数化。各参数的符号、单位和赋值见表1。模型参数通过现场观测和已发表的文献获得。根据胶州湾半日潮的潮汐类型,模型的步长设为3 h。初步运行模型,与调查结果进行比较,对蛤仔的半饱和系数
|
|
表 1 生态系统模型中的参数取值 Tab.1 Parameters of the ecological model |
胶州湾菲律宾蛤仔养殖区和周围水域的硝酸盐(
进行养殖容量评估过程中,先确定在期望的养殖时间(本研究为10个月)蛤仔达到商品规格的最大养殖密度,然后测算养殖过程中所需要的养殖成本、产量和市场价格,以经济效益最大化确定适宜的养殖密度。其中,养殖成本主要考虑蛤仔苗种的价格和投苗量。
| $ {\pi _0} = {\text{Bi}}{{\text{o}}_{{\text{b}}0}} \times {P_1} - {\text{M}}{{\text{N}}_0} \times {P_0} $ | (38) |
式中,
基于2018年5月—2019年2月的跟踪观测结果,模拟得到胶州湾菲律宾蛤仔生长情况和浮游植物(碳)浓度结果及与实测结果的线性回归关系(图1)。结果显示,菲律宾蛤仔个体湿重和浮游植物(碳)浓度的模拟值与实测值动态变化趋势基本一致,菲律宾蛤仔个体湿重的模拟值和实测值呈显著线性相关(R2=0.934 8, P<0.01),浮游植物(碳)浓度的模拟值和实测值呈显著线性相关(R2=0.926 4, P<0.01)。

|
图 1 胶州湾菲律宾蛤仔个体湿重、浮游植物(碳)浓度实测值与模拟值结果的比较 Fig.1 Comparison of observations and simulations of wet weight in the clam and phytoplankton concentration in Jiaozhou Bay A:个体湿重模拟结果与实测结果对比;B:个体湿重模拟结果和实测结果回归分析;C:浮游植物(碳)浓度模拟结果与实测结果对比;D:浮游植物(碳)浓度模拟结果和实测结果回归分析 A: Comparison of simulated and observed wet weight; B. Regression of simulated and observed wet weight; C. Comparison of simulated and observed phytoplankton concentration; D. Regression of simulated and observed phytoplankton concentration |
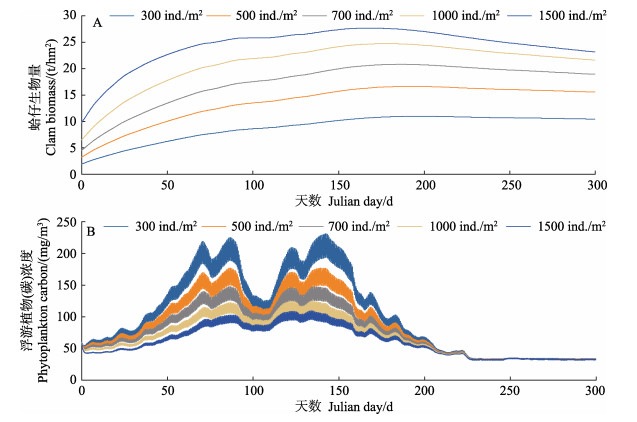
将菲律宾蛤仔的初始播种密度设为300、500、700、1000、1500 ind./m2时,蛤仔生物量和浮游植物(碳)浓度的变化情况如图2所示。在期望的养殖时间(10个月),初始播种密度分别为300、500、700、1000、1500 ind./m2时,蛤仔的生物量在150~200 d达到最大值,最终产量分别为10.5、15.6、18.9、21.6、23.2 t/hm2。初始播种密度分别为300、500、700、1000、1500 ind./m2时,浮游植物(碳)浓度变化趋势一致,均有多个峰值,最大值分别为231.3、176.9、147.6、125.1、109.8 mg/m3。

|
图 2 不同初始密度条件下的菲律宾蛤仔生物量(A)和浮游植物(碳)浓度(B)的模拟结果 Fig.2 Model results of the clam biomass (A) and the phytoplankton carbon (B) for different clam culture scenarios |
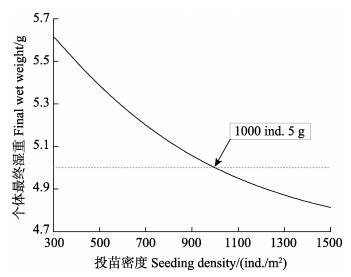
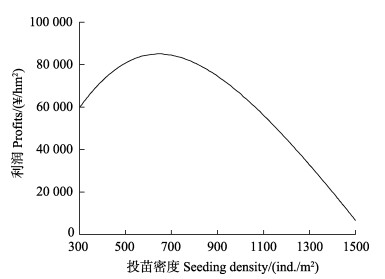
基于生态系统动力学模型的胶州湾菲律宾蛤仔养殖容量评估结果如图3所示。随播种密度变化,蛤仔最终个体湿重逐渐降低,若在期望的养殖时间(10个月)收获商品蛤仔,养殖密度应低于1000 ind./m2。不同播苗密度情境下的经济效益分析结果显示,放苗密度为550~750 ind./m2时,得到的利润最大(图4)。

|
图 3 收获时蛤仔个体湿重随放苗密度的变化 Fig.3 Variation of final individual wet weight of clams with seeding density |

|
图 4 利润随播种密度的变化 Fig.4 Variation of profits with seeding density |
菲律宾蛤仔的个体生长模型是本研究生态系统动力学模型的关键子模块,已有模型中的食物来源仅采用了叶绿素a作为食物来源,本研究中对贝类模块的摄食方程部分进行了优化,将浮游植物和颗粒有机物(POM)共同作为蛤仔的食物来源,提升了模型模拟的科学性和准确性(董世鹏等, 2020b)。从个体湿重的模拟结果来看,模拟值与实测值吻合(图2)。从生长趋势来看,养殖前期生长迅速,中期增长缓慢,养殖后期由于水温降低、食物短缺等因素,体重增长停滞甚至下降,这些生长特征与已有文献对该地区蛤仔的生物学调查结果基本一致(郭永禄等, 2005)。
浮游植物生长受水温、光照和营养盐等因素的影响(Chapman et al, 1997)。根据浮游植物的模拟结果(图1C)可知,模拟前70 d,浮游植物(碳)浓度高速增长,主要是因为该段时间内水温逐渐升高,光照强度逐渐增强;在模拟80~150 d,浮游植物(碳)浓度出现明显下降的趋势,这可能是因为夏季高温抑制了浮游植物的光合作用;模拟150 d后,浮游植物(碳)浓度逐渐减少,这主要是贝类摄食、光照强度减弱和水温降低协同作用的结果。氮对浮游植物生长的限制作用较为明显,所以本模型选取氨氮和硝态氮构建营养盐模块(Gibbs et al, 1997)。浮游动物在胶州湾的生态系统中发挥着重要作用(李秀玉, 2012)。胶州湾的浮游动物与蛤仔存在食物竞争关系,当模型中去除浮游动物的影响,浮游植物和蛤仔的生物量均会增加。另外,鉴于浮游动物的总体排粪量相对蛤仔较少,在模型中忽略了这部分对碎屑的影响。
本研究通过耦合菲律宾蛤仔个体生长模型和生物地球化学模型,构建了胶州湾NPZD-C生态系统动力学模型,并将蛤仔模块和浮游植物模块的模拟结果和实测结果进行了统计分析,结果表明,该模型可以较好地再现各个模块的动态变化情况(图1)。在模拟结果的基础上对蛤仔养殖情况进行了评估,结果显示,随着蛤仔播种密度的增加,蛤仔最终产量变化幅度逐渐减小,尤其在播种密度大于1000 ind./m2时,由于个体重量较低而死亡率较高,产量增幅很小;浮游植物的变化趋势主要受水温控制,当蛤仔密度升高,出现了整体下降的趋势。以该模型为基础,将利润作为胶州湾菲律宾蛤仔养殖容量评估的标准,给出了期望收获时间适宜的放苗密度(550~750 ind./m2)。与刘学海等(2015)的研究对胶州湾5个养殖区菲律宾蛤仔放养密度的评估结果对比,4个养殖区的建议放苗密度在本研究的评估结果区间内,有1个养殖区的放养密度(805 ind./m2)略高于本研究的评估结果。另外,我们在之前采用静态的Herman模型评估胶州湾菲律宾蛤仔养殖容量,以2龄蛤为采捕对象的建议播种密度为582 ind./m2,该值也在本研究的评估范围之内。
需要指出的是,基于生态系统动力学模型评估的养殖容量因对于环境质量、产量、经济效益等关注点的不同而有所变化,并没有统一的标准。Ferreira等(2007)构建的Farm模型重点关注水体质量,将食物浓度和水体含氧浓度作为评估标准。Stigebrandt (2011)的研究将养殖容量标准分为养殖生物可接受的最低标准和环境可接受的最大影响,前者主要包括底栖动物、氨氮和溶解氧(>5 g/L)等指标,后者包括透明度和溶解氧(>3.0~3.5 g/L)。Pete等(2020)研究计算了泻湖浮游植物衰减指数,来判定该海域贝类养殖容量。本研究的养殖容量评估采用的标准为限定时间内达到商品贝最小规格的最大放苗密度和经济效益最大化的养殖密度,评估结果可以帮助养殖户制定适宜的养殖管理策略。
营养盐是生态系统模型中链接浮游植物子模块和贝类子模块的重要子模块,受限于地形和流场数据缺失,本模型中的营养盐数据来源是逐月走航观测的实测结果,后续研究将构建胶州湾水动力模型,并将水动力模型和生态系统模型耦合,进一步提高模型的准确性。
ANDERSEN V, NIVAL P, HARRIS R P, et al. Modelling of a planktonic ecosystem in an enclosed water column. Journal of the Marine Biological Association of the United Kingdom, 1987, 67(2): 407-430 DOI:10.1017/S0025315400026709 |
AURE J, STROHMEIER T, STRAND Ø. Modelling current speed and carrying capacity in long-line blue mussel (Mytilus edulis) farms. Aquaculture Research, 2007, 38(3): 304-312 DOI:10.1111/j.1365-2109.2007.01669.x |
BAYNE B L, NEWELL R C. Physiological energetics of marine molluscs. The Mollusca, 1983, 4: 407-515 |
BIENFANG P K. A new phytoplankton sinking rate method suitable for field use. Deep Sea Research Part A. Oceanographic Research Papers, 1979, 26(6): 719-729 DOI:10.1016/0198-0149(79)90043-8 |
Bureau of Fisheries, Ministry of Agriculture and Rural Affairs, National Fisheries Technology Extension Center, China Society of Fisheries. China fishery statistical yearbook 2021. Beijing: China Agriculture Press, 2021 [农业农村部渔业渔政管理局, 全国水产技术推广总站, 中国水产学会. 2021中国渔业统计年鉴. 北京: 中国农业出版社, 2021]
|
CAPERON J, MEYER J. Nitrogen-limited growth of marine phytoplankton-Ⅱ. Uptake kinetics and their role in nutrient limited growth of phytoplankton. Deep Sea Research and Oceanographic Abstracts, 1972, 19(9): 619-632 |
CHAPELLE A. A preliminary model of nutrient cycling in sediments of a Mediterranean lagoon. Ecological Modelling, 1995, 80(2/3): 131-147 |
CHAPMAN B R, FERRY B W, FORD T W. Phytoplankton communities in water bodies at Dungeness, U. K. : Analysis of seasonal changes in response to environmental factors. Hydrobiologia, 1997, 362(1): 161-170 |
CORKETT C J, MCLAREN I A. The biology of Pseudocalanus. Advances in Marine Biology, 1979, 15: 1-231 |
COUNCIL N R. Ecosystem concepts for sustainable bivalve mariculture. National Academies Press, 2010
|
DAME R F, WOLAVER T G, LIBES S M. The summer uptake and release of nitrogen by an intertidal oyster reef. Netherlands Journal of Sea Research, 1985, 19(3/4): 265-268 |
DESLOUS-PAOLI J M, HÉRAL M. Biochemical composition and energy value of Crassostrea gigas (Thunberg) cultured in the bay of Merennes-Oléron. Aquatic Living Resources, 1988, 1(4): 239-249 DOI:10.1051/alr:1988024 |
DONG S P, LIN F, JIANG W W, et al. Estimation of carrying capacity of Manila clam (Ruditapes philippinarum) in Jiaozhou Bay based on spatial and temporal distribution of chlorophyll a. Progress in Fishery Sciences, 2020, a,41(6): 100-107 [董世鹏, 蔺凡, 姜娓娓, 等. 基于叶绿素a时空分布的胶州湾菲律宾蛤仔养殖容量评估. 渔业科学进展, 2020, a,41(6): 100-107] |
DONG S P, LIN F, JIANG W W, et al. Simulation and validation of Manila clam Ruditapes philippinarum growth with a DEB-based individual growth model in Jiaozhou Bay. Progress in Fishery Sciences, 2020, b,41(4): 94-101 [董世鹏, 蔺凡, 姜娓娓, 等. 胶州湾菲律宾蛤仔个体生长模型的构建与验证. 渔业科学进展, 2020, b,41(4): 94-101] |
DONG S P. Construction of individual growth model and estimation of carrying capacity of Ruditapes philippinarum in Jiaozhou Bay. Master´s Thesis of Shanghai Ocean University, 2020 [董世鹏. 胶州湾菲律宾蛤仔个体生长模型构建及养殖容量评估研究. 上海海洋大学硕士研究生学位论文, 2020]
|
DOWD M. A bio-physical coastal ecosystem model for assessing environmental effects of marine bivalve aquaculture. Ecological Modelling, 2005, 183(2/3): 323-346 |
DOWD M. On predicting the growth of cultured bivalves. Ecological Modelling, 1997, 104(2/3): 113-131 |
EDWARDS A, GRANTHAM B E. Inorganic nutrient regeneration in Loch Etive bottom water. In: SKRESLET S, ed. The role of freshwater outflow in coastal marine ecosystems. NATO ASI Series, vol 7, Berlin Heidelberg: Springer, 1986
|
FERREIRA J G, HAWKINS A J S, BRICKER S B. Management of productivity, environmental effects and profitability of shellfish aquaculture—The farm aquaculture resource management (FARM) model. Aquaculture, 2007, 264(1/2/3/4): 160-174 |
FILGUEIRA R, BYRON C J, COMEAU L A, et al. An integrated ecosystem approach for assessing the potential role of cultivated bivalve shells as part of the carbon trading system. Marine Ecology Progress Series, 2015, 518: 281-287 DOI:10.3354/meps11048 |
FILGUEIRA R, GUYONDET T, COMEAU L A, et al. A fully-spatial ecosystem-DEB model of oyster (Crassostrea virginica) carrying capacity in the Richibucto Estuary, Eastern Canada. Journal of Marine Systems, 2014, 136: 42-54 DOI:10.1016/j.jmarsys.2014.03.015 |
FLYE-SAINTE-MARIE J G. Ecophysiology of brown ring disease in the Manila clam Ruditapes philippinarum, experimental and modelling approaches. Amsterdam Vrije Universiteit, 2008
|
GIBBS M M, VANT W N. Seasonal changes in factors controlling phytoplankton growth in Beatrix Bay, New Zealand. New Zealand Journal of Marine and Freshwater Research, 1997, 31(2): 237-248 DOI:10.1080/00288330.1997.9516761 |
GOLDMAN J C. Temperature effects on phytoplankton growth in continuous culture. Limnology and Oceanography, 1977, 22(5): 932-936 DOI:10.4319/lo.1977.22.5.0932 |
GUO Y L, REN Y P, YANG H B. A study on the growth characteristics of the clam Ruditapes philippinarum in Jiaozhou Bay. Periodical of Ocean University of China, 2005, 35(5): 779-784 [郭永禄, 任一平, 杨汉斌. 胶州湾菲律宾蛤仔生长特征研究. 中国海洋大学学报(自然科学版), 2005, 35(5): 779-784] |
GUYONDET T, SONIER R, COMEAU L A. Spatially explicit seston depletion index to optimize shellfish culture. Aquaculture Environment Interactions, 2013, 4(2): 175-186 DOI:10.3354/aei00083 |
HATCHER A, GRANT J, SCHOFIELD B. Effects of suspended mussel culture (Mytilus spp. ) on sedimentation, benthic respiration and sediment nutrient dynamics in a coastal bay. Marine Ecology Progress Series, 1994, 115(3): 219-235 |
INGLIS G J, HAYDEN B J, ROSS A H. An overview of factors affecting the carrying capacity of coastal embayment for mussel culture. Ministry for the Environment, New Zealand, 2000
|
JIANG W, GIBBS M T. Predicting the carrying capacity of bivalve shellfish culture using a steady, linear food web model. Aquaculture, 2005, 244(1/2/3/4): 171-185 |
KASPAR H F, GILLESPIE P A, BOYER I C, et al. Effects of mussel aquaculture on the nitrogen cycle and benthic communities in Kenepuru Sound, Marlborough Sounds, New Zealand. Marine Biology, 1985, 85(2): 127-136 DOI:10.1007/BF00397431 |
KIEFER D A. A reply to the comment by Bannister. Limnology and Oceanography, 1990, 35(4): 980-982 DOI:10.4319/lo.1990.35.4.0980 |
KIØRBOE T, MØHLENBERG F, HAMBURGER K. Bioenergetics of the copepod Acartia tonsa: Relation between feeding, egg production and respiration, and composition of specific dynamic action. Marine Ecology Progress Series, 1985, 26: 85-97 DOI:10.3354/meps026085 |
KOOIJMAN S A L M. Pseudo-faeces production in bivalves. Journal of Sea Research, 2006, 56(2): 103-106 DOI:10.1016/j.seares.2006.03.003 |
LI X Y. Study on the zooplankton community near Hongdao in Jiaozhou Bay. Master´s Thesis of Ocean University of China, 2012 [李秀玉. 胶州湾红岛附近海域浮游动物群落生态学研究. 中国海洋大学硕士研究生学位论文, 2012]
|
LIU H, CAI B Y. Advance in research and application on aquaculture carrying capacity. Progress in Fishery Sciences, 2018, 39(3): 158-166 [刘慧, 蔡碧莹. 水产养殖容量研究进展及应用. 渔业科学进展, 2018, 39(3): 158-166] |
LIU X H, WANG Z L, ZHANG M L, et al. Carrying capacity of Manila clam Ruditapes philippinarum in Jiaozhou Bay estimated by an ecosystem model. Fisheries Science, 2015, 34(12): 733-740 [刘学海, 王宗灵, 张明亮, 等. 基于生态模型估算胶州湾菲律宾蛤仔养殖容量. 水产科学, 2015, 34(12): 733-740] |
MCKINDSEY C W, LANDRY T, O´BEIRN F X, et al. Bivalve aquaculture and exotic species: A review of ecological considerations and management issues. Journal of Shellfish Research, 2007, 26(2): 281-294 DOI:10.2983/0730-8000(2007)26[281:BAAESA]2.0.CO;2 |
MCKINDSEY C W, THETMEYR H, LANDRY T, et al. Review of recent carrying capacity models for bivalve culture and recommendations for research and management. Aquaculture, 2006, 261(2): 451-462 DOI:10.1016/j.aquaculture.2006.06.044 |
NAKATA K, HORIGUCHI F, YAMAMURO M. Model study of Lakes Shinji and Nakaumi – A coupled coastal lagoon system. Journal of Marine Systems, 2000, 26(2): 145-169 DOI:10.1016/S0924-7963(00)00051-8 |
OFFICER C B, SMAYDA T J, MANN R. Benthic filter feeding – A natural eutrophication control. Marine Ecology Progress Series, 1982, 9(2): 203-210 |
PARSONS T R, TAKAHASHI M, HARGRAVE B C. Biological oceanographic processes (2nd Edition). Oxford: Pergamon Press, 1977
|
PETE R, GUYONDET T, BEC B, et al. A box-model of carrying capacity of the Thau Lagoon in the context of ecological status regulations and sustainable shellfish cultures. Ecological Modelling, 2020, 426: 109049 DOI:10.1016/j.ecolmodel.2020.109049 |
REN J S, ROSS A H, HADFIELD M G, et al. An ecosystem model for estimating potential shellfish culture production in sheltered coastal waters. Ecological Modelling, 2010, 221(3): 527-539 DOI:10.1016/j.ecolmodel.2009.11.003 |
REN J S, STENTON-DOZEY J, PLEW D R, et al. An ecosystem model for optimising production in integrated multitrophic aquaculture systems. Ecological Modelling, 2012, 246: 34-46 DOI:10.1016/j.ecolmodel.2012.07.020 |
ROSENBERG R, LOO L O. Energy-flow in a Mytilus edulis culture in western Sweden. Aquaculture, 1983, 35: 151-161 DOI:10.1016/0044-8486(83)90082-0 |
ROSS A H, GURNEY W S C, HEALTH M R, et al. A strategic simulation model of a fjord ecosystem. Limnology and Oceanography, 1993, 38(1): 128-153 DOI:10.4319/lo.1993.38.1.0128 |
STIGEBRANDT A. Carrying capacity: General principles of model construction. Aquaculture Research, 2011, 42: 41-50 DOI:10.1111/j.1365-2109.2010.02674.x |
STILLMAN R A, MCGRORTY S, GOSS-CUSTARD J D, et al. Predicting mussel population density and age structure: The relationship between model complexity and predictive power. Marine Ecology Progress Series, 2000, 208(1): 131-145 |
TANG Q S, JIANG Z J, MAO Y Z. Clarification on the definitions and its relevant issues of fisheries carbon sink and carbon sink fisheries. Progress in Fishery Sciences, 2020, 43(5): 1-8 [唐启升, 蒋增杰, 毛玉泽. 渔业碳汇与碳汇渔业定义及其相关问题的辨析. 渔业科学进展, 2020, 43(5): 1-8] |
TANG Q S, ZHANG J H, FANG J G. Shellfish and seaweed mariculture increase atmospheric CO2 absorption by coastal ecosystems. Marine Ecology Progress Series, 2011, 424: 97-104 DOI:10.3354/meps08979 |
TETT P, DROOP M R. Cell quota models and planktonic primary production. In: WIMPENNY J W T, ed. Handbook of laboratory model systems for microbial ecosystems, 1988, 177-233 |
TYLER I D. A carbon budget for Creran, a Scottish sea loch. Doctoral Dissertation of University of Strathclyde, 1983
|
VAN DER VEER H W, CARDOSO J F M F, VAN DER MEER J. The estimation of DEB parameters for various Northeast Atlantic bivalve species. Journal of Sea Research, 2006, 56(2): 107-124 DOI:10.1016/j.seares.2006.03.005 |
YIN L Y, YANG Z C, YU Z N, et al. Shellfish aquaculture problems and countermeasures. Fisheries Science, 2012, 31(5): 302-305 [印丽云, 杨振才, 喻子牛, 等. 海水贝类养殖中的问题及对策. 水产科学, 2012, 31(5): 302-305 DOI:10.3969/j.issn.1003-1111.2012.05.013] |
YURISTA P. A model for temperature correction of size-specific respiration in Bythotrephes cederstroemi and Daphnia middendorffiana. Journal of Plankton Research, 1999, 4: 21 |
ZAN X X. The research of biology and ecological stoichiometry of Ruditapes philippinarum and Phragmites australis and ecological restoration in Jiaozhou Bay wetland. Doctoral Dissertation of Ocean University of China, 2013 [昝肖肖. 胶州湾湿地菲律宾蛤仔(Ruditapes philippinarum)和芦苇(Phragmites australis)生物学与生态化学计量学研究. 中国海洋大学博士研究生学位论文, 2013]
|
ZHANG M L. The research of carrying capacity of shellfish in the Jiaozhou Bay. Master´s Thesis of the First Institute of Oceanography, 2008 [张明亮. 胶州湾贝类养殖容量研究与分析. 国家海洋局第一海洋研究所硕士研究生学位论文, 2008]
|
ZLOTNIK I, DUBINSKY Z. The effect of light and temperature on DOC excretion by phytoplankton. Limnology and Oceanography, 1989, 34(5): 831-839 DOI:10.4319/lo.1989.34.5.0831 |


